Wednesday, November 30, 2016

Dec 2016

Surprised I received a early buy signal Wed so I need to watch that.


Recap Thursday, low volume side ways drift
Fri- humm forgot to post,I had us drift higher all day.
Tues-Fri Happy New Year , I think low volume and we will drift higher all week.

 Recap Wed:
Must be in an inversion window since mkt has done opposite of my data. We had a gap up with high good at (9:50) but sold off. Thursday look for a gap up open with a 10:20 low and sideways to up close.
**************************************************************************** 

 Recap Tuesday:
We had a useless low around 10:30 but the gap was a big up not dn.
Wednesday wants to gap dn again with a 10AM high, side ways to up close. 
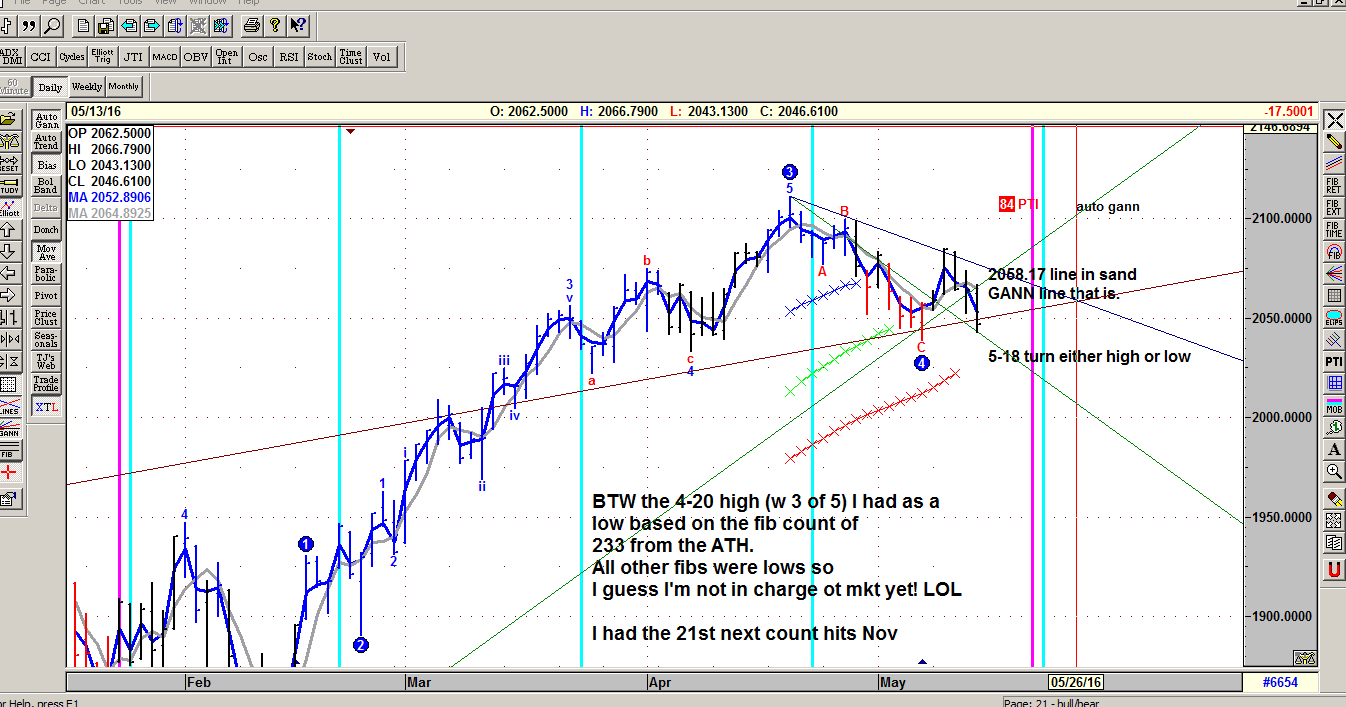
If W2 +W3 =115 pts then Spx 2363 could be expected, but what ever last day of year bring is where I want to short .
******************************************************************************

 Recap Monday: Little gap dn but 10:40 and 11:05 were highs still did the sideways move.
Tuesday Gap dn again is called 10:30 low but again flat. I think Wed will be a bigger up day. 
 *******************************************************************************
 RECAP Fri-He He, we did just the opposite 9:35 h then a 10:40 high to run lower.
OK Monday looks mixed with 2 inside days in a row that I consider bullish but wasn't. Look for a gap down open then a 10:20 MAster low or a general time 10:05 low to regain rest of day or flat out.
Still look rlly into last day of DEc.
Here is what Advanced Get is saying. It called 3 days ago 5 of (3) with wave 4 downside.limited.


recap Thursday:
We did have a big upgap putting the HOD at 11:20 another valid time frame and flattened out rest of day.
Friday I look for a 10:30 low and run higher into the close' 
*****************************************************************************
Recap Wed  No gap but flat open,low 10:15 but PM just fell apart. Thursday looking for big up gap, 10:05 high then go flat rest of day.


****************************************************************************
Recap Tuesday. Sure inverted. I looked for a 10AM high we got a 10:30 low that sent us higher all day.
Wednesday Again I look for a gap down or indicator do I should say. 10:20 low to flat day, then the Fed who knows but probably  relief rally.


***************************************************************************
Recap Monday 12th 
High was at 10 AM not  10:30. High AM to low PM day it was.
Tuesday 13th I look again for the same play. Gap down , high AM, low PM day. The trend is still up till Dec 30th where I will get short.   Jerry


Fri recap:
Gap dn no! but rest of call was good. We had a 10:15 low (-5m) and again ran up higher.
Monday I again look for a gap dn with 10:30 high, but probably will close lower.


Thursday Recap: Low was at 10:11 and we ran higher all day. No real gap.
Friday Look for a  gap down  and again a run up Low @10:20 but centered @10:30.
Most are calling today "THE" high. I would wait for the retest if that is the case. My 1952 model says we rally into  end of Dec.


Wed recap: I was looking for high at 10:05 but had a low at 9:55, that killed the signal and we were SU all day.
Thursday look again for a gap dn ( 3 say dn) 10:30 low  and then run higher. Christmas rally in progress.


 Tuesday recap:

We did have a gap dn,    we did have the 10:20 low actual 10:25.
Wednesday Dec 7th Indicators are   mixed (up,up,dn) Since we are over bought close will look for gap dn,
then a  High  10:05 down rest of day, Time to break this uptrend or I'am wrong about AM high.
*****************************************************************************
Monday recap gap dn didn't happen, 10AM HOD did happen.
Tuesday Dec 6th looking for a gap dn  low AM probably 10:20, could be sharply lower.


Monday Dec  5th look for gap down open (3of 3 indicators). Expect a high AM probably 10 AM but many center it @ 10:30 AM. Looking for Spx 2085 soon.
Jerry O


Dec 1st  Thursday
I look for a gap up open, low AM day, rally most of day.
Recap we had a rally into 10:05 am not he gap up I would have liked, and we went down most of day.
**************************************************************************
Dec 2nd indicators are mixed but expect gap up with AM  High could hold most of day.
Getting a early buy warning so we could have a big rally coming soon.
Jobs report moves markets.

Saturday, November 19, 2016

Day Trading TG WK

Been to busy to post!

 Wed was gap dn  9:45 was low, do opposite you did alright.
I didn't post for  Friday but looked for a gap dn again no times. We gaped up.
Monday Nov 28th again indicators  look for a gap dn, I don't think it will fail and the time is 9:45
We should again mount a rally into the close Jerry O
***************************************************************************
Tuesday had the gap and the 10:30 time of AM high but was 15M late ( not bad), technically we should have not rallied into the close. Perhaps a setup of some sort?
Wed  indicators look for a gap up. ( 2 gaps in a row same direction usually don't work)
Times 9:40 and 10:20 for direction
 ************************************************************************
 Monday update and Tuesday call.
GAP was wrong but rest of day right, unplayable with such a large gap.
TUESDAY looks for a gap UP.   10:30 key time do opposite.
***********************************************************************

Day Trading
Monday  21st 2016 November
Indicators are diverging so a tougher call.
I look for a gap down to buy this weeks call options.
After the gap down or up, I still want to get long. This is a high AM
day that I think will invert to a high PM day.
I trade OEX options since you can
trade up to 4:15PM –E.T.

Ps. Here was Friday 18th post that worked well.
Friday Indicators looked for a Gap dn, rally into 10:10-11:05 centered 10:30, then down rest of day.
Worked great today, except for the gap all that did was get me in puts earlier.
Made 2 points.
Monday indicators are diverging so will have to study that but expect choppy waves.

Daily count from Advanced Get .

Saturday, August 27, 2016

Looking for rally Tuesday or Wednesday


Sat Aug 27th 4:26 PM ET
After loading all my data from vacation!
Getting buy signals, look for low Tuesday Aug 30 Spx 2150 +/-
Wednesday is orange day last 10 of 12 have been up.
It is also the 31st a good EOM rally will pursue.
Will it take out old high I don’t know.


Also working on a buy/sell program based on Joel GreenBlatt book @ Amazon
and some one named
Michael Carr
and his pattern x theory

I have refined these works to my own time frame and understanding, with out the wild claims from either.
Jerry O

Saturday, July 16, 2016

ST target 2111 SPX

OK we never got the gap down and still are marching for 2111 SPX .
Still over bought so nothing has changed. We could plunge at any time or rally due to the overbought condition.


After running my data:
We had an outside day considered bearish by me 70% of the time.
Wave 5 of v Advanced get.
Double top.
Super over bought.
4.94% model very overbought
My moon count looks favorable.
I think 2011 is still coming but we need a rest.
We will need a strong gap down Monday to set this up
 Jerry O   click chart to enlarge

Saturday, July 9, 2016

Are U ready for 2211 Spx M term

I have and remain bullish.
Using Advance Get and Friday rally we have switched from an ABC to wave 5 that should extend.
I don't know how A Get came up with 2211 in it's formula but here is mine.
Wave 2 =1891  Wave 3 =2111 or 220 Spx points
Wave 4 = 1991 + 220 = 2211
I have strong support at 2185 all on chart, I will post.
Good trading Jerry O


Wednesday, June 29, 2016

spx 2090


People who know me know I like 3 and 100
Advanced Get changed from a Wave 3 to a bullish wave C.
I should have said It yesterday it could change.
I look for 2090 either Ju 30th or July first.
"Nay Sayers" look at 2-11-16 a C wave.
We went from 1810 to 1930 in 3 td or 100+ pts
Gann angles loves it. 

 click to enlarge

Monday, June 27, 2016

Rally time

I have been pounding the table all day saying the market (SPX) is down but so is the  VIX.
NO one responded as if SO WHAT ?
Here is a chart to what I speak.
The green lines = SPX  and the red-black = VIX. When the VIX peaks like today but the SPX didn't turn up I expect a GAP higher in the SPX  and a meaning full rally.
click chart to enlarge.

Monday, June 20, 2016

I see no bears.

Simple trend lines show more than you think.

My dates have been +/- 1 TD  not bad.

Tuesday, June 7, 2016

Remember the 7th or 17th

Here we are one day before the 7th my first target  date and we hit the 5th wave. I think there is a little more upside because the moon is in a favorable phase. Unless we have a crazy gap higher that is clearly unsustainable I think we could slowly go higher.
If we remain calm I would look at 17th. Even if we drop a little there should be a 5 TD retest of high.
 click chart to enlarge

Sunday, June 5, 2016

Working Bollinger Bands

Most people will buy or sell when the BB is pierced by a stock or index.
Usually this works very well but if you use a 3 zig zag it clears the picture.
I have annotated a chart to show a few examples on the current SPX
Jerry  June 5th 2016

Friday, June 3, 2016

We are 5.80 away from a wave 5

A close above 5.80 Spx ((2111.06 ) will offer a Wave 5. That could offer a bigger breakout higher.


Tuesday, May 24, 2016

Ahead for the week


Auto Gann lines are working again.
Scenarios for Wednesday   Fill the gap
                                            Fill the gap but close above 50DMA
                                     or    Range   the gann lines 2059 -2071

I expect a higher high Friday  27th. And into Mid June,later, but not in stone!
Jerry O

Tuesday, March 29, 2016

Turn date the 18th

Update May 18th  "The 18th has called the bottom. I think we rally now into mid June +
On the chart the gann lines offer little down side 2033.30 for Thursday, 2045.60 and 2058.67 an we should close above that by Friday.
If I'am wrong then you need to raise my pay. Jerry
Never take trading serious from the Net my disclaimer 


Ok I have been away. My plunge date was the 21st but was to my surprise a high. Since all the other fib dates were lows who would
think a switch was coming. I was to my regret out of site and out of mind at the time.     My next turn date based on other works calls for the 18th.
Gann lines should give us the trend with magic number 2058.17 Spx
for Monday  May 16th. This week should be a big money maker!


Here are some links I hope are live:http://stockcharts.com/h-sc/ui?s=%24NYADU&p=D&yr=0&mn=6&dy=2&id=p73348678572&a=448638968

Showing just how overbought we are.

http://stockcharts.com/h-sc/ui?s=%24BPSPX&p=D&yr=0&mn=6&dy=2&id=p92911779640&a=446729007


Friday, March 11, 2016

Newer noiseless charts

Looking at my unch chart we see it getting more overbought. That can mean complacency or excess!Yes it is overbought a signal yet,NO!  I have studied this chart back years and see the 83% line as a buy/sell line. If we are below that line and it cross's it is a buy. So we need to see the OB  line come down to the 83% to get a sell.  Thought's it could lead to one last overblown rally.
LIVE EOD

http://schrts.co/RvMK5v


Next chart is the $BPSPX and after a strong climb it has finally leveled off. Again not a bear till it starts down.
My thoughts is it is a lager not a leader but still has to follow the script . So looking for divergences as alway's. These are simple charts to (kiss) keep it simple stupid.
Live EOD

http://stockcharts.com/h-sc/ui?s=%24BPSPX&p=D&yr=0&mn=6&dy=2&id=p92911779640&a=446729007

Jerry O
ps Draghi wants to buy corp bonds, banks want him to buy  non performers. I think he is killing his banks.

So far no overlaping of wave 1 so still bearish lean 


Monday, March 7, 2016

Trying to find overvalued

http://stockcharts.com/h-sc/ui?s=%24BPSPX&p=D&yr=0&mn=6&dy=2&id=p92911779640&a=446729007

This is a live chart updating EOD     I show the UNChanged and how overbought it gets at highs.
So we are close to a turn down.
Then there are other OB/OS like the RSI   vs the SPX and NYA
Friday the rally seemed to peak in late afternoon. This is based on stocks that were much higher and then either closed unch or lower. Was this the overbought mkt peak?
Today added the MACD + some OB/OS areas with guidlines.

Updating my Fib chart and notice the change in date from April 15 to April 21 as I had looked at the wrong date. Thanks Kevin.

You will notice the boxes. The last signal was 144 fibs and we dropped in 9 days 111 SPX points
(2104-1993) If history repeats the mkt should enter that box at some level as a high.
Jerry O


Wednesday, March 2, 2016

Strip out the Noise

Today we hit the .618 area on the SPX  @ 1978.14+ and important wave ending,I hope.
Futures are up strong at 1:30 AM ET
Window Dressing?
If you look at this chart of the BPSPX  you will see where I put the arrows.
What is interesting is the low was Nov 3rd but almost every thing else as far as highs was at or near the 29-1st of each month.
So the high should be in but is it ?


Thursday, February 25, 2016

Kiss of death sell.

Looking at the ADX that could be the kiss of death sell that has worked before.
There is a chart from Advanced GET looks a lot like now and how we could pay out to get the April low I look for.


Tuesday, February 23, 2016

W or M pattern AGET pattern

I say it is an M pattern!


Saturday, February 20, 2016

Bull or Goat

The goat will ram ahead and then go eat grass.

Monday, February 15, 2016

Where's the BEEF?

Pure and simple a momentum run and short covering enhanced by Jimmy Diamond. Strange on a 3 day weekend. Looking at charts to find a
fractal. Not even sure it was a breath thrust. I hope it was a bull trap.
Holiday weeks can have big moves. Color me skeptical.
Later Jerry

Later with charts


 Projection  from AGET and my thinking.

Tuesday, February 9, 2016

On Spx 1740 watch

Monday email post:\Unless we rally sharply into the close and cancel the parabolic buy signal.
Then that parabolic light buy signal ( Pattern )suggests lower into Friday.
Sharp moves.
If however we plunge into the close LOD then I would buy for a 1 TD rally
Jerry

After close update. Stayed flat since neither happened. 
Tuesday email post at 11am 
Inside days are bullish in bull mkts. I don't think this is a bull and a full candle is more bearish.
after close update. Making a little change Target will be raised a little to range 1740-1765 SPX.
Wed down, Thursday up a little, Friday intraday L.O.Wk 
Based on Parabolic pattern 

Saturday, February 6, 2016

Mild Correction so far


Indicators have turned down with ADX blue turning up (bearish on a 1 TD view.
 FRIDAY MKT big % drop


Wednesday, February 3, 2016

retest should start

We hit 1947.20 Tuesday, important day.
We should be on the way to retest low.

Jerry

Saturday, January 30, 2016

Rally to SPX 1954 still the thought


Look back to Sept,2 arrows green line. This us now.
TOP CHART


#2 chart
Look back to Sept again, green ADX kiss blue falls. Watch next 2 days see if cross (rally) or fails

#5 chart
MFI should come back to lower line circle if not then real rally.


Time frame next 2-3 days.When I post text changes :(
Jerry

Friday, January 29, 2016

OIL and spx 1737


Is oil going up?
I don’t know but many say yes it is due from oversold targets. My heating oil man called today, said I have some left at this low price $1.47 low for this area. Do you want a fill I said yes since I watch prices.
Here is a site to check local prices if you live in New England.

As far as my call for Spx 1737 that is expected in April. Since the all time high the Fibs have been spot on  +1- day. ( next Spx 1634 no date)
You will notice not only the F233 from ATH but F89 from Dec 14th low.

First we could rally to 1920-1954 if oil can hold. Just a news driven mkt.
Jerry


Tuesday, January 26, 2016

Tuesday, January 12, 2016

Target 1979/1991

Based on wave 4 or pivots on pitchfork.
MFI in deep OS and other indicators turning up.

Friday, January 8, 2016

LOW is in

Charts based on key pivots and very oversold MFI not shown.


 Jan 8th 3:15 pm

I said yesterday we would at least hit 1938.83 Spx
Since 1932.92 has been hit  no double bottom.
My parabolic says we either hit a low at close or the low is Monday.