Saturday, October 13, 2012

Looking 1410 Spx by Tuesday


 More of the bear look click charts to enlarge
 NYAD ready to fall?IF it does you can see the target at bottom.
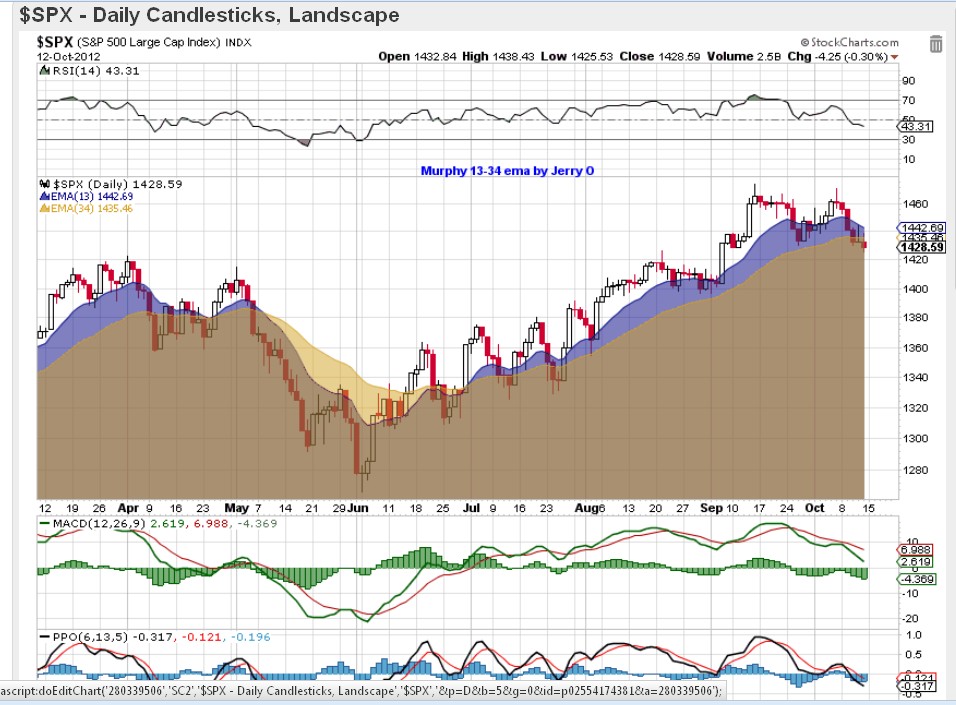
 My 1410 target spx and volume review
 If it turns yellow it will be too later. 13-34 is a little slow buy a good indicator.
 6 TD moving average on P&F
 Could be the crash wave,
or just a normal wave 5 sell off.
This is not my chart I think it was Stockcharts.com but it shows Q3 will be a
big failure ay least in my mind set.
How so? Well the old adage the market never
reacts the same way to the same news.

Wednesday, October 10, 2012

Market weakness is appearing.

Here we have the Railroads. After the gap down and break of support they tried to recover to gap fill but have failed.

 New York  adv/decl showing real weakness. You can see real downside if this pattern continues. Blue line suggests a target
 This chart I never got posted here the other day. At that point I was looking for 1430 now the possible target is 1410. Volume is in no mans land usually bearish till we break out.
 Stock above 50  dma are in trouble but this all can change in a heart beat. We need to get under 1390 for that to happen.
 Here I have put the Bollinger bands on all schemes. The blue line just shows a point in time thatbecause we have hit BB and 50 DMA that we could go a few more lower.I would say we are MOB ( make or break)
Click charts to enlarge.  Jerry O