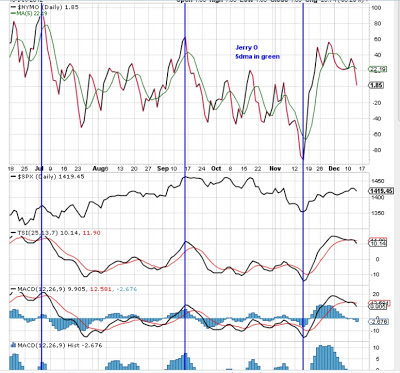
I have no call for Friday. I didn't like the action today ( 3:30) that call to the WH stopped what could have been a good oversold buy.
Will ponder this chart.
Many crossovers that make the market look weak.
I may try a scalp.
My thoughts do the opposite of 9:40-9:45 since this is S3 yellow.
Trending the SP500 SPX using proprietary cycles. A mechanical program (excel formula's) and the use of Advanced Get (Elliot waves) to both visually show what my spread sheet offers and how Advanced Get understands it. I'm also using a MOON COUNT that has been working nicely! Use at your own risk to supplement your own work. Jerry
Friday, December 14, 2012
Wednesday, December 12, 2012
K.I.S.S.
Update Thursday:
Had a $3 profit at 3:30 and was trying to sell zoom zoom up ( that damn white house).
Made only $1.2 per but love to win.
I looked for a rally today as I said yesterday.
I had hoped to get overbought but only one of my 3 indicators turned positive.
We have been up 5 days in a row and surely can be 6.
I seen no volume or any change in anything to confirem todays rally but the rally is not over.
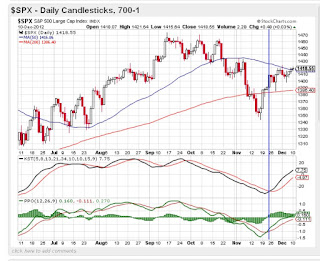
I did buy a few Oex puts on a gut feeling based more on this chart.
We have hit this brick wall area 5 times. We have the same candle as circled.
My thought is we could pull back for 1 1/2 days at this time.
Don't marry options sell if a profit.
The Fed has nothing to offer but does the White House.
Today I had a cycle hit H to H I hope.
Jerry O
Monday, December 10, 2012
Bullish Charts with P/c Oex 3.74
Starting off with the Oex p/c ratio @ 3.74 not always but usually offers a big move I suspect up.
Chart to left is in bull town what comes next sooner or later bear town.You can stay overbought
longer than your money will last.
This is a problem that the RR's are coming back. A cross of that red line could spook a rally.
Spx with buy signals weeks ago and holding.
The strongest group is Cyclical or one of them and that is bullish as a basic group.
Subscribe to:
Comments (Atom)


