Saturday, March 14, 2015

Rally Time

click charts to enlarge


Friday, March 13, 2015

Rally could be much ado about nothing!


Rally could be much ado about nothing!
My MA cross/over  still on a sell!
My mechanical model still on a sell!
We hit a fib level today. Charts way below.
I think we watch for high AM low PM. (3:30)
Spx 2056.70 is on my radar.

Charts
Advanced Get to my surprise offered daily close wave 3 with little up power.
Based on that I have lower my S#2
Live Elliot Wave offered no surprise but an intraday wave 5.


Thursday, March 12, 2015

Tuesday, March 10, 2015

More downside


Update at 3:15 Tuesday
Remember my target in advance is Spx 2009 to 2020 posted Saturday
Today we have 863 advance 2200 decl so far
NH 20 NL 119
This will feed on it's self.
 Look like it will be tomorrow,  at least, unless we dip the last 45M  
Jerry O


 **************************************************
12:30 Update. Tuesday
Once (if) we break 2050 I look for much more down.
IF counting I see only W1 & W2 in so far.  I'm not a pro counter at all.
It's important we close on the LOD    low of day JO


Monday close
The most bullish thing I can say is we had an inside day usually bullish.
I suspect it won't work. Had the vix been positive that would have been bearish missed by .15.
Volume had a down tilt most of the day. New lows have picked up.-I'm still on a MA sell.
We closed on a S/R area not only long term but intraday
Conclusion Unless we take out 2083.49 on the open I would expect a drop or sharply down day.     JO


Saturday, March 7, 2015

My Scenario

I have been real bearish for over a week buying some oex puts,some vix calls and spy puts.
Too late to get short now,me thinks, there will be a better short entry if I have this right. BTW for protection, Fun and games only.
Don't believe any thing you read on Internet. That said here we go!
First chart ( click to enlarge) Elliot Trigger offers more down side---.S/R offers 2019 (ALL SPX) --Fib ..618 offers 2008  My best guess is we have a good low for a WAVE A.
Interesting March 6th is 6 years from the devil number 666 on March 6th 2009.

More clues we were  ready to turn. Of course the 4.94 pattern way below. This is the Bollinger bands offering a CIT in that configuration. John Bollinger offered it as a golden nugget in his course.
click chart to enlarge.    Jerry O


Friday, February 27, 2015

We are close 4.94%


This 4.94% has picked every top for the last few years based off of the 125 SMA.
At 2115 SPX we hit that %+, sure it could range for a few more days but chances are something big will blindside us.The end of month window dressing is over etc. Greek rethink,Fed funds etc.
The VIX is also in place to rally. I bought some June 14 calls on the vix they seemed to be the cheapest option around. OEX and SPX were priced to perfection.
Happy trading Jerry O
BTW the kidney stones were removed, very painful, today first time no pain at all.


Friday, February 20, 2015

DN CIT

update close 23rd
So far not ready to fall. We are over bought.There is a 96% correlation to the 1956 stock market that was a very choppy year. We need a gap down at the close to change the air or pattern.

 **********************************************
Going to add a few charts I think worked.
Looking for Spx 2010 by next Friday the 27th based on this CIT on today's close. (19th) Hopefully it will be  WAVE A of an ABC  as pictured below.

click charts to enlarge   Jerry O


Wednesday, February 18, 2015

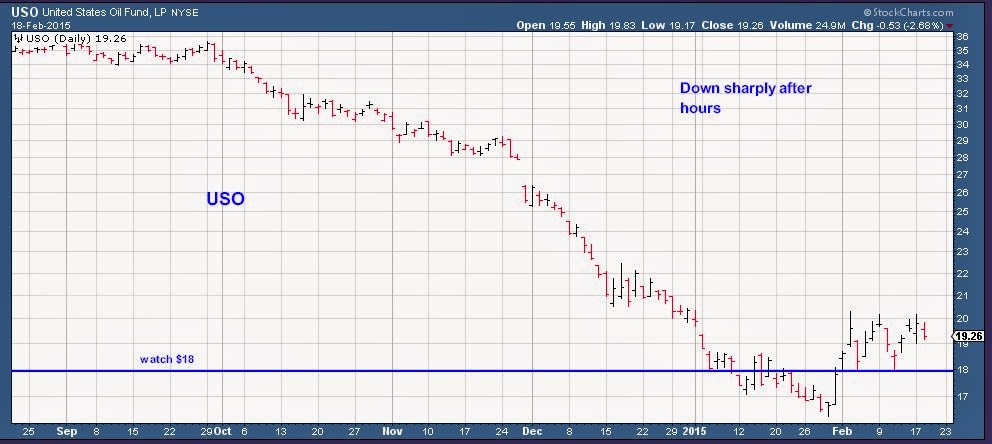
Oil in free fall?

Update posted at 10:30 Pm on the 18th
Reviewing my work *I see today is an inside day -I usually consider that bullish if it is near a low but I don't think we are at a low so watch that one.
* 4 TD  sum of volume is low showing confusion with traders.
*Blowout days. I have not spoke of that of late but today was the lowest reading since the last high on 12-29-14 .  FWIW.


I don't know if OIL rules the Stock Market or not but looking at these charts I would think it has a big hold over the market. The only reason I bring this up is the big dip in USO and OIL today the 18th Feb.
After hours the drop continues. I write in Red because I'm bearish.


Jerry O
I expect fireworks with the options this last 2 days.


Tuesday, February 17, 2015

Down Wednesday

Today was not a good day.
We jammed the close.
We had the Vix up with the SPX = down next day ( 85% of time)
The market internals were not great with deciners more than advances. The last 1/2 volume was a hedge trade I would suspect.


Monday, February 16, 2015

2088 on watch for Tuesday 2-17


The last high we had was on 12-29-14 @ 2093.55 Spx leading up to that we had 8 days in a row of higher highs. Currently 2-13-15 we have 4 Days of higher highs. If we look at the Market internals for the 29th we see a strong thrust into the close with 2/1 advances but nothing as strong as last Friday where we had 190 new highs only 5 new lows and 2/1 up volume. Friday the 13th was much more greedy all around.

I don’t give it more than 2 TD if that greed rate keeps going.


The Advanced Get chart I have built offers a pitch fork nightmare putting us right in that triangle. I offer 2088 as a line in the sand.

You will notice AG has us in a Wave 5 configuration so a sharp move down of 100 SPX points would be expected when we turn.

Is this the final top, I have no clue.

Jerry O

 12-29-14

 2-13-15