Thursday, February 10, 2011

More weakness appears

I have to stay with this theme above.. We have the spx+vix up today = down Friday (75% of time it works). Still watching this fractal, not the close, but the range, as history rarely repeats.
Watch spx 1313.63, then 1302.83 on a close basis.
The weakness I see: The % of stocks above there 50dsma is getting weaker as we rally. This is a different event since Aug. I have marked off a few dates with a line that could be a catalyst.
Some one said to me today I think 1300 holds, but the more I think about it, if not, a panic will unfold. I do have 1212 down the road but I have higher numbers too.Price is KING for direction.

Click any image to enlarge. Speaking of what is different look at rates climb. Some thing is a miss Watson. Other than above comments the trend is UP.

Weakness appears

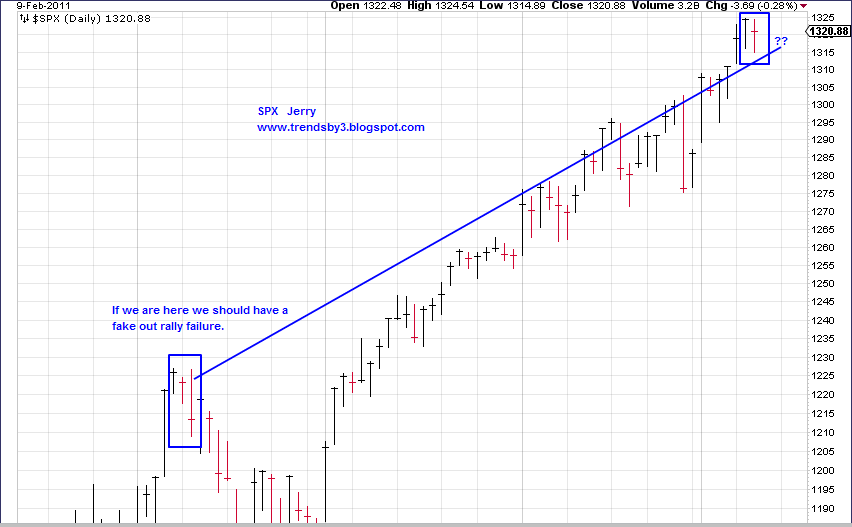
Is this a Short term top? Need to watch one more bar, a rally failure could do the job. Even at that I think the target is 1212 Spx based on yesterdays chart. Right too the area where the last correction started.


This is a chart of the SOX vs SPX the dates I have marked off on the cross over didn't really do much to the market. What we do need to watch is both turned down. We need to watch that.

Jerry

Wednesday, February 9, 2011

Trend remains up even if correction.

From yr 2000 high we get 1360.22, from the 2007 high we get 1380.98. A pull back at anytime could only offer 1212 spx. So a seasonal rally or plunge into April 25th ish not out of the question.

We need to keep an eye on rates as they start to creep higher.

Monday, February 7, 2011

Trend Still Up unless

We have the EDT still in force. 1315 area or as AGET says it's complete now with (5)-5-V.
I have put on the target the elips offers 1280-1250
Monday watch 1309.02 then 1297.07 ( pivot @ 1298.52) then 1294.64 other than that, I see no chance of a CIT.
This chart of the percent of Spx stocks above their 50 day SMA is not all that bearish as yet.
A break under the 50 level is an alert and under 45 a sell officially.
I have added speculative lines that in fast markets give good sells or buys. Some key area's like January high 2009 and March low 2009 stick out. Mid Oct 2010 vs Jan 2011 may offer a divergance since we have climbed higher but basically we are are still in buy the dips mode.

Friday, February 4, 2011

Friday big down? watch 1303.06

Scenario #1 watch 1303.06, and Cit 1293.37 Spx
Thursday to Thursday almost same setup before the big drop. Upvolume,Tick trin and vix very similar. Did we double top? Unemplayment number will be good not because job were created but people have dropped the hunt for a job. Remember last Friday big drop and we have many hits this Friday on cycles.


Scenario #2 Bernanke speak Buy, buy, buy, baby, and we head for Spx 1315 a cluster. EDT

Wednesday, February 2, 2011

Ground Hog day High and reverse?

Update Thursday
The most exciting thing today was the Ground Hog say's it will be a short winter.
Thank you Hog.
Market didn't hit a high as hoped for. The trin was 1.43 and a tick of -1047. Last time this happened was 6-3 with big drop next day. I would watch Spx 1301.58 and 1290 if it happens a CIT. On the bullish side the SPX and Vix both down calls for up (80%) chance.


Looking for Intraday high and reverse. Will I get it to finish this target. 1315 Spx


Pivots in 1/8's


Tuesday, February 1, 2011

Getting Cautious

We see the Spx (^gspc) support resistance. My trend model is telling me the pressure is 1284 down, 1287 up. 2 days at most is my guess for higher.

The other weakness is the Dow and the 30 are not hitting new highs for the last 4 days not a good sign.

Sunday, January 30, 2011

I don't think this is it.???

This looked and had EDT action. click charts to enlarge.


It just stopped at support! We have Tuesday with 1st day of Month indicator saying up. Hirsch saying Feb 1st up 7 of last 8, Nas up 6 in a row. An the S&P study if you are going to buy only 1 day per month make it the first day of each month.


This Gann box yellow line says well we are hitting resistance. Lets see how the 4th looks. That day we have a 144TDL,55TDH and 9,18,36 TDL hitting I think it will be a higher low. If I'm wrong then the 1247-50 gap is a target and we have an uptrend line hitting 1150 all Spx.


This is a Fractal from Hank at http://twitter.com/Frac_Man of course it was dead on.
I post this chart to see if it will have any mapping effect, my idea only, a fractal is for one day as far as I know.

Sunday, January 23, 2011

Trend Still UP unless

I will just post some charts, many say we are at a turn area but hasn't happened yet. We need to close below some of these numbers.

We have a sell on the parabolic. (my settings)


Red week can offer a trend change..............................

Gann Box at turn level but of course it can higher...

The 15degree high finder has offerings here too.

The bootm line no trend change yet but on high alert. Jerry

Friday, January 21, 2011

Trend Change Pending

Trend change if we close under 1277.92 Spx
This chart offers a view of what could happen Friday since volume has followed this same 5 day pattern of 11-16 taking us to 1262 spx support.

click chart to enlarge.