
Wednesday, October 31, 2012
Saturday, October 27, 2012
EOM rally

Right on the sell line!!!!! 3 sideway days not helpful ...

Looking for 1350 but since it had 1500 ear marked I would say for many reasons 1375 is a target IF..

I will guess 31st and Nov 1st as EOM rally days
Volume and Spread sheets tell me we are in limbo,
so news like Sammy not that bad could spark
a rally.
Earning are under pressure so expect a short lived
rally.
Jerryo1314@aol.com


Wednesday, October 24, 2012
Targets
We could kiss 1400 tomorrow or lower but I think next week will be up since it is EOM window dress.
Will Wall Street be open? We get that rain with Wall Street lower than sea level it's in trouble.
Jerry
Targets on the upside is 1425 and strong resistance 1433.81.
With the PC at .99 and a trin of 2.74 a rally attempt is ahead.
We had upvol of 12% so over sold.
Soon the down side target will be 1376.34 or 1370
We have a 144TD hit Thursday.


Sunday, October 21, 2012
Day 20 of 40 TD cycle Monday

If we look at the volume bar circled it has the bottom look.
I think we will attack 1438 then strong resistance at 1445-1448 with a fictional double top at 1451/52.
Support is 1425 then 1410.
Best Jerry
Tuesday, October 16, 2012
way off-count change
I keep saying all year the market was not over sold enough to have this big a reaction. Sure would like to know the algorithm the street computers use!
Here is a change in AGET with the count chaning to wave 4 from wave 5.
Also AGET (mob) had a target of Spx 1425 I felt we would blow through that to 1410 ya right.
The bias has given another buy.

Here is a change in AGET with the count chaning to wave 4 from wave 5.
Also AGET (mob) had a target of Spx 1425 I felt we would blow through that to 1410 ya right.
The bias has given another buy.

Saturday, October 13, 2012
Looking 1410 Spx by Tuesday
 |


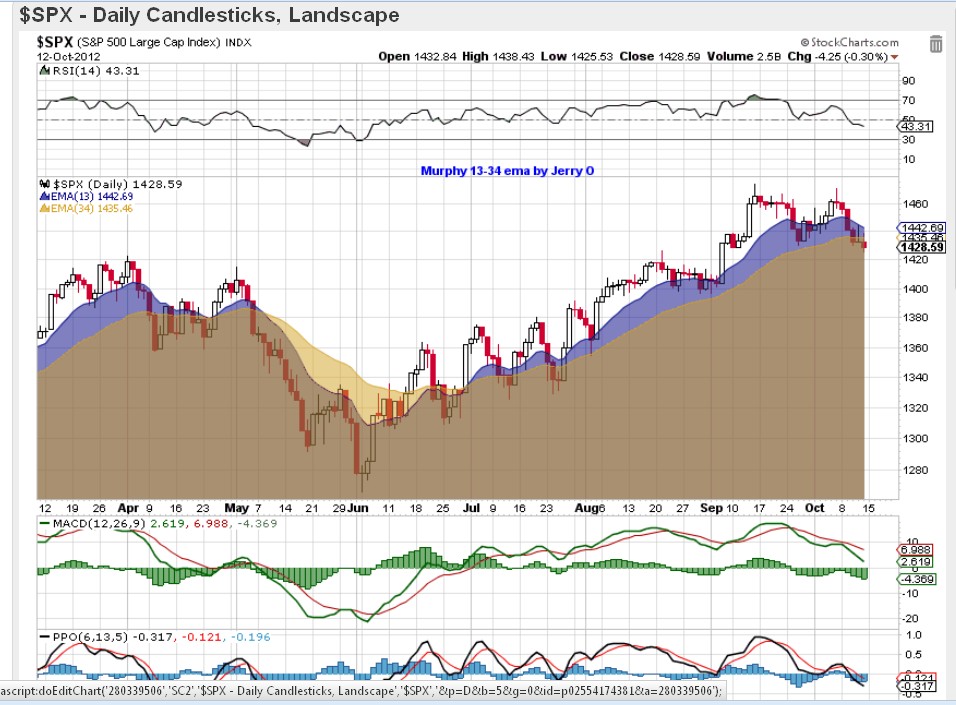


or just a normal wave 5 sell off.

big failure ay least in my mind set.
How so? Well the old adage the market never
reacts the same way to the same news.
Wednesday, October 10, 2012
Market weakness is appearing.
Here we have the Railroads. After the gap down and break of support they tried to recover to gap fill but have failed.


Saturday, September 29, 2012
STill 1430 Support 1500 R 10-22Low


The above charts just shows the weakness we all know about, but a chart is worth 1000 words.
Jerry
Monday, September 24, 2012
Trans vs Dow update

This chart above is how Stockcharts explains the Dow Theory. The chart below is several charts of Tran/Indu and several bare charts to help get a view. If you wait for the Dow Theory you will leave a lot on the table.


The common wisdom is if the transports go down the market will follow. Going back to 1999 I find that a little hard to prove. I'm open to suggestion because I maybe looking at this chart wrong but there are times the trans seem to have no effect on Spx. I draw a few lines to help line up the Trans with the Spx on the bottom.
Jerry
Sunday, September 23, 2012
1500 Resistance 1430 Support Spx

1500 Resistance 1430 Support Spx. Till some thing happens I guess these are the cards.
My 40 TDH hopefully came last week and we can correct. First down Friday in 8 weeks.
I'm still overbought. Can the Transports lead us down yet again, or will energy tumble.
Click chart to enlarge.
Subscribe to:
Posts (Atom)