Thursday, May 5, 2011

SPX Weekly


Click Image to enlarge.

Friday, April 29, 2011

Getting Strange.

As we look at this upvolume chart and since we have just had a 3 day Spx rally of over 25 points, I have to wonder how the upvolume can be going down. Last 3 days was 70% then 65% now 61% as market makes new highs.


Here we see what could be a big divergance on the stocks above 50%. We are making new highs but the chart looks toppy hitting a down trend line.
Click chart to enlarge.


I have a 144TDH today Friday 4-29-11 could this end the rally?
End of month window dressing.
Jerry O

Tuesday, April 19, 2011

CIT to DOWN

I have a change in the trend to down. My VVST and VVT went on a sell as pictured.
But when the long term trend changes to down I need to ring the bell and that has happened.
Can we go higher, yes a little but 1322 Spx should hold the line.

This of course is a mechanical system just following the numbers.


What I don't show on this sheet is the $VIX. The went below 14.99 on 4-15-11. You have to go back to 7-12/13 07 to see those number right before a nice correction.
Even The $Vix at 15.25 has been a topping area many times over the last 4 years.
This is for fun an games only. Use with your own work!
Jerry


Tuesday, April 12, 2011

Sell but getting OS

Above EW can't go below 1301 or the count is wrong. I think we are probably at a bottom 1310 but a 8-9% upvol day could call the low. The trend up is still strong it appears so a pullback like we are having will be light pullback.
What has me puzzled is the vix just not considering a pullback here. Is their a surprise coming?

Bottom chart we see the % of stocks above 50 dma right at the border of a sell. Unless we have a big down day not expected I don't think we get the sell on this indicator.
On the upside I think 1320 then 1328 spx kicks off a rally.


Monday, April 11, 2011

VST sell

I have gone to a very short term sell.
AGET suggests a wave 4 target of 1317 to 1310.
One weird thing is the vix dropped to day with market down. VIX+SPX say's rally tomorrow about 70% accurate. Market is so tight no one knows what we are wait for, but could be the 27th as Bernanke has first open press conference


Wednesday, April 6, 2011

Kicking and screaming higher!


The ISEE is neutral
Stock above 50 dma are considered on a buy but getting over bought

The up vol % has been 50% ,58%, 61% so neutral also.
What is bearish the vix. It has been a good time to buy longer term puts of think more bearish with it under 17 of late.

Sunday, April 3, 2011

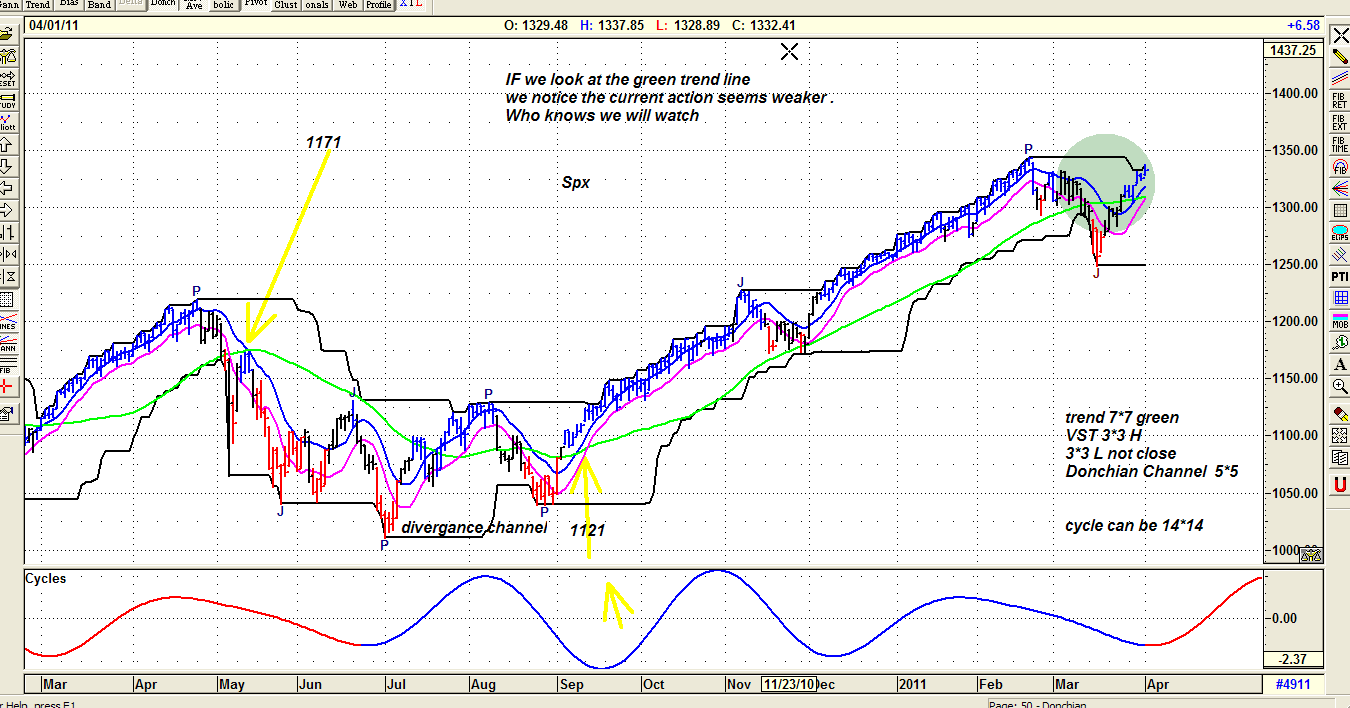
Trend is UP until.


As far as my model I think i said it but it went to VST buy on 3-24 crossing both 1298.33 and 1304.28 on that same day. On 3-29 it confirmed a up CIT was happening.
Today and yesterday we started to look weak but not close enough to a sell, for Monday 1321 could kick it off but not going to happen. When we hit 1344 and plunged the next day I felt it was not a high because it didn't follow the pattern I have worked on in the archives.
IE: you hit a high then pullback next day but 3 day you do a fakeout rally not topping but scary.

Saturday, March 26, 2011

Very short term buy.


We went to a vst buy Thursday morning. We need to get below 1306 then 1300 very quickly or the trend will remain up and we will kick in a CIT. Nothing goes straight up.

One bearish thought here that we bounced off one Gann cluster (lower) to the (upper) for a stop sign.

Saturday, March 19, 2011

Still looking down


Predictions

>This is not Japan 1995 after that EQ this is two different major events the out come will be different. Forget that history template.

>The Fed will find its hands full with Japan, Yen vs. QE2 vs. Japan treasury holding.

A severe cut back in QE2 US purchase program.

>Inflation will climb as shortages create demand in certain products. Aka Richard Nixon freezes.

Our 1250 target filled faster than first thought, so fast is good.

Charts as we look at Advanced Gets Elliott Wave format we notice that SPX 1250 was there to be hit, we notice an overlap at 1294.26 so we should not go much above that and 1300 should be strong resistance. Or this count is wrong.

You will notice on the gap charts that 1257 is a huge target.

On the chart of stocks % above the 50sma you will notice we were weak before Japan and last 2 days with a lot of market noise we are still on a sell.

I stick with my target of 1115 SPX on or near 4-25 currently, sell the rallies.

http://trendsby3.blogspot.com/

http://www.barchart.com/quotes/futures/$SPX

Jerry

Thursday, March 17, 2011

Finding the low.

The major correction in April 4-26-10 H was a 17% lower move to 7-1-10.
If we use that as our template then 2-18-11 - 17% would = spx 1115.58

If 4-26-10 to 7-1-10 is 66CD (calendar days) or 45 degree.

Then 2-18-11 H to low 4-25-11 or 45 degree and 360 degree from the 4-26-10 low. H to L anniversary.

Summary spx 1115.58 target on 4-25-11

Jerry O