Sunday, December 11, 2011

Manipulation gone wild! Update Sell


This indicator has gone to a sell. If one looks where the sideways arrow are we see the average decline of a minimum of 25+ Spx points if everything is relative. And it will not be a 1 day affair.
Jerry O


The market we have is not the market I want. I fight the fed who wants to kill the $$$. Dollar down
US market up.
I fight the Euro since they also want the market up they refuse to pump the banks. So Euro up US markets up.
Can the egg crack sure but after being bearish for 2 weeks guess we will have to get extremely over bought.
Monday the 12 th is settlement of futures so that could be interesting but only for the moment.
This is the third time we have taken a shot at the 200dma on the Spx.

I will sit back and watch.
Jerry O

Saturday, December 3, 2011

Last week to bearish, same this week LOL. Thursday update


Thursday Close: We went on a 1 day Vix sell on Wednesday. Click chart to blow up size.


Topping signs are starting to show.


Some one asked me to look at the Gann line and we have perfect cross at Spx 1253 with a target on the MOB of 1133 on 12-15-11


Do to fast markets we drove back above the bull line on 11-28/29


VIX BELOW


The VIX: Going with Wealth Builder site the 200dma is a buy/sell line. Notice we were under the 54EMA ( Jerry O) as the rally to 121292.66 took place even under the 200dma for 2 days. I show this because here we are again so watch direction of the Vix next few day. AGET has a target of minium 55 on the Vix but that could take awhile, or not. Also a poster say's we had a bullish red hollow candle on the Vix Friday, so more reason to watch it..

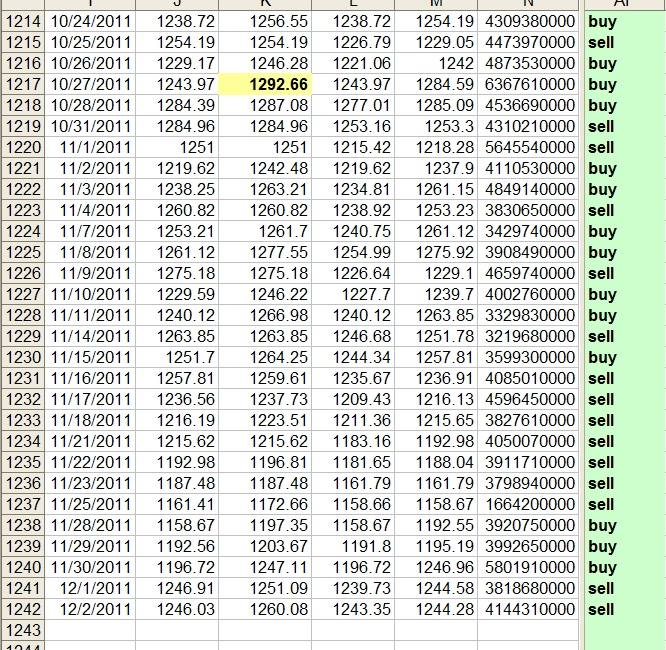
On this spread sheet I did a simple formula to look at what happens when the market closes lower than the gap open. Not to put money on but to watch. If we have 2 days where the sell comes it tends to be bearish. Some Excel wiz could come up with a winner I bet. Green column is the signal


Click charts to enlarge.
Spx in black line and Vix in candle

Sunday, November 27, 2011

Target Spx 1020+/- 20

Day 5 of bear market.
This chart is not my buy/sell setting look at other posts. If this is 2008 action, then the drops will pick up speed.
On this chart I have days labeled as a reference could be 1T day off.
In May 1345 to Jun 1258 or (7%- 87-points)
June 1347 to Aug 1101 (18%-246 points)final was (21% -273 points to 1074) ....
Now Oct 1292 to Nov so far (10%-1158) but expect it to go to (21%- 1020) BTW 21% was very common in 2008.
Happy Holiday's

This 1020 by year end.

Monday, November 21, 2011

We are 1 day into a bear market !


On this chart from 2009 -2011 you can see the action of the buy and sell area's 80 overbought take a minimum short, over 90 a strong short.

To go long I use 15 to take a small long but 8 or under you need to load the boat.
We are today 11-21-11 -- 1 day into bear market. An area that could whip.

StockCharts version is
http://stockcharts.com/h-sc/ui?s=$SPXA50R&p=D&yr=1&mn=1&dy=0&id=p16006213521&listNum=3&a=206277545
***********************************************************************************
Next we have 2007 to 2009.
I have the ATH market in Oct 2007 marked in Green. You will notice it was hard to find a move above 80.I have no idea why 2011 had 90's.

I have marked divergence also.


NEXT 2001 - 2003


********************************************************************************

This is as far back as I could go.
Coming out of the bear give more idea's of where we should go if this bear is in the works finally.


Http://trendsby3.blogspot.com/

Sunday, November 20, 2011

Monday UP !

Bullish Monday, why.
Screw the Committee in DC. To many think it bearish.
Vix + SPX down = up day.
Inside day = Up.
Spy up +.17 after hrs.
Index PcR .88 = extreme seen near highs in a few days from now. Leading indicator.
Seasonally bullish. Will watch 1217 then 1220 for strength. Spx.

What if it's a bear trap.
We will look at this chart.

L 1249,Buy on 3-23@ 1297 High 1339 + 42 pts
June 1st sell 1314 Buy June 30 1320 -6 pts sell high July 7th 1356 + 36 pts
Sell-July 27th 1304 low 10-4 1074 etc.
Using the buy/sell on this chart from Stockcharts.com is useless but if you tweak it there are big opportunity's.
This chart clearly shows we are topping at 1292 and perhaps ready for a big slide. Cross the green line is a clue but Friday we had a little hint of a turn. Nothing goes straight down.

Jerry O


Barcharts suggest a sell mode!
http://www.barchart.com/quotes/futures/$SPX

Saturday, November 12, 2011

The big picture, my view. Orange week.


A bullish pattern so far but we need to complete a wave 4 at say Spx 1200 (centered) If W2 =W3 142 points and W4 not complete = 1200 then wave 5 = Spx 1342

From W3 to where W4 a .618 retrace should hit
Spx 1198.00/1203.33 area. Or a .618 Dow level 11500.72
needs to happen soon.


If not we could still be in a WAVE 3 UP ! Or we need to take out
W1 @1165.55 to kill this scenario.

Week ahead is orange pattern has most Mondays down.
Again I'm overbought on a Friday 4 weeks in a row.
To tell the truth there is too much smoke and mirror to make a call till we do a technical move.

Jerry O

Saturday, November 5, 2011

We are running out of Gas.

As we look at this chart we notice the big drop starting backing in April 2010 and lasting several months. However you can't get there in a few days' I know there is a lot of talk of a crash but at 85%? No I think we need to get to 75% at least for a hole to open up.

For the last 3 weeks I have been seriously overbought but this week just overbought.

This is a green week with Monday a green day. Looking back it is very hard to find a down Monday on a green day.
http://www.programtrading.com/color.htm

MEBOB monthly we are in a down trend till 1292.66 breaks not expected.
CYCLES: I had a 23cH from the 1074 L on Friday.
Spx vs vix call for Monday up (70%) reliability.
AGET is lost in ABC land.
And then there is the news driving the market more than ever.

Saturday, October 22, 2011

The end is near

On this chart i have drawn blue vertical lines at extremes.
May 8ht-09 in 5 td we went from 929 c to a low 878 =51 pts
9-22-09 in 3 td 1071 to 1041 = 30 pts
4-14-10 in 16 td 1210 to 1065 = 145 pts we did hit 1219 on way down.
11-19-10 we wentin 5td from 1199 to 1173= 26pts
So a pull back is near then reassess. My understanding is that back in Oct 1974 we had a rally like this that in Nov-Dec fell hard.


Update Monday night

Today i had the highest system number 14C TD from the 1074 spx low.
I had to go back to MAr 2009 just 14C TD from the 666 low.

Bottom line if we open lower you could plunge 53 spx point in 2 days before the rally resumes.
Well that was what we did in 2009


INSANELYOVERBOUGHT !!!!!!!!!!!!!!!!!!!!
2 weeks in a row so a repeat of a Monday big hit?
Looking at the color day we could expect Wednesday to be big reversal since it is blue!
Correction a Green day so not sure.

click on image to enlarge


Wednesday also has a proprietary count as a high.

Saturday, October 15, 2011

One word! update

Update for Friday OE:

The PC ratio at 1.90 is bullish with the $spx+vix indicator bearish for Friday.
Still on a sell but all we have done is go up and down. If Tom Demark couldn't call it today on Bloomberg how can I ??


update:
Official sell was Friday close or open today.
Look for spx 1163 soon


INSANELYOVERBOUGHT !!!!!!!!!!!!!!!!!!!!


Jan 2011 to pending OE in Oct 2011 on Spx.

We think the high is normally Thursday of option week but facts speak different.

Jan 2011 Blue week High Monday, Low Thursday

Feb 2011 Blue week Highs Thursday Friday, lows M-Tu

March Blue week High Monday , low Wed, then sharp rally

April Blue week High Monday, Low Thursday

May Red week Low Tuesday High Thursday

HOY so far May-2-11 @ 1370 spx

June Red week High Tuesday, Low Thursday

July Red week High Monday, Low Thursday

August Green week High Monday,Low Friday

September Green week low Monday, high Friday

Oct in play

So net net the chances for a high are Monday and a low Wed/Thursday, or visa versa if Monday is a low, so watch for the action vs the last Friday for clues. Monday could have a big trading range failure. Monday is the key to OE week.

Jerry O

Wednesday, October 12, 2011

Going to a sell/update

Thursday Chart for Friday click to enlarge.

Up late tonight checking my facts. We have tested 1220/1230 several times (Spx). My numbers are right where I want them. A few have gone extreme.
I will be shocked if we can do anything but go down after Thursday market.
So putting it on the line here we could /should be heading for Spx 1086 or a retest of the low.
All in Oct.


What ever higher high we have in next 2 days should be it. Wed the 12th is a blue day and this rally started on the 4th also a blue day.
We have the PC ratio at 2.03 and other numbers I use getting to over bought levels.
I have 1193 then 1184 as signs of weakness. SPX
We should have an am high and then start to flounder. Not a one day event.