
Friday, June 3, 2016
We are 5.80 away from a wave 5
A close above 5.80 Spx ((2111.06 ) will offer a Wave 5. That could offer a bigger breakout higher.


Tuesday, May 24, 2016
Ahead for the week
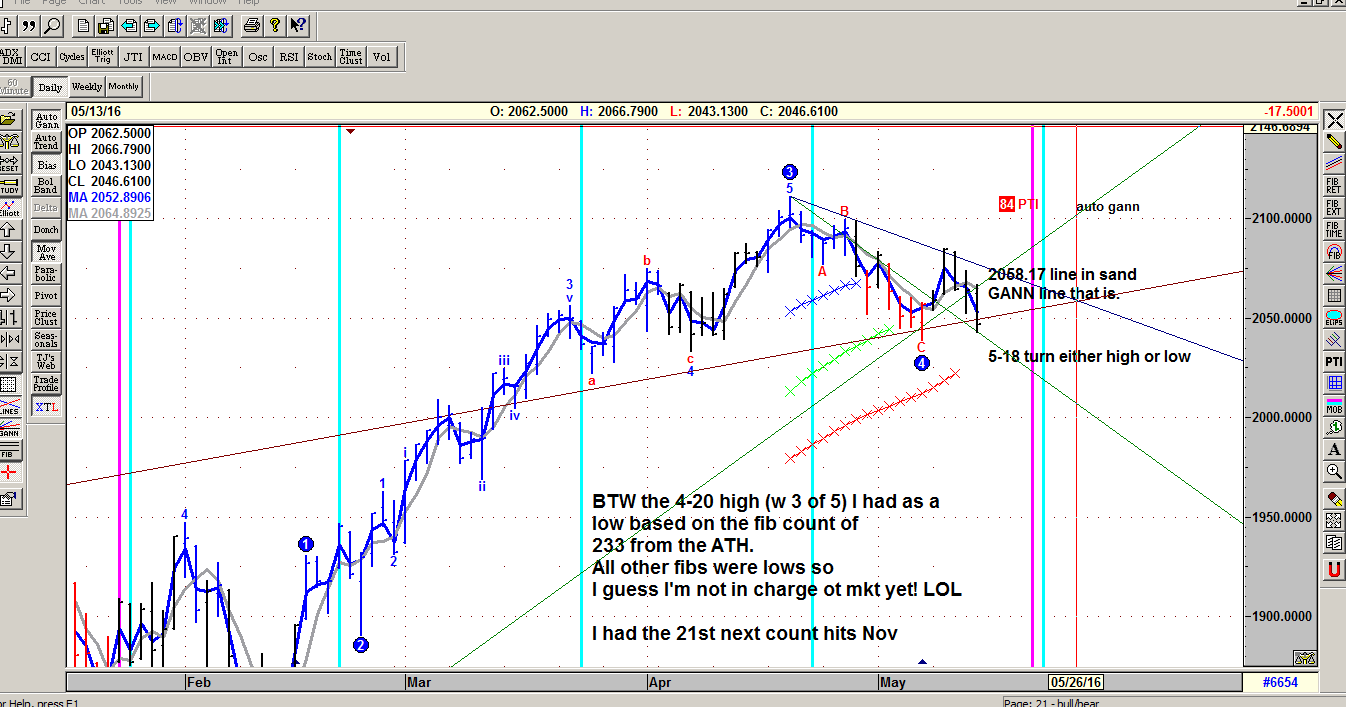
Auto Gann lines are working again.
Scenarios for Wednesday
Fill the gap
Fill
the gap but close above 50DMA
or Range the gann lines 2059 -2071
I expect a higher high Friday 27th. And into Mid June,later, but not in
stone!
Jerry O

Tuesday, March 29, 2016
Turn date the 18th
Update May 18th "The 18th has called the bottom. I think we rally now into mid June +
On the chart the gann lines offer little down side 2033.30 for Thursday, 2045.60 and 2058.67 an we should close above that by Friday.
If I'am wrong then you need to raise my pay. Jerry
Never take trading serious from the Net my disclaimer
On the chart the gann lines offer little down side 2033.30 for Thursday, 2045.60 and 2058.67 an we should close above that by Friday.
If I'am wrong then you need to raise my pay. Jerry
Never take trading serious from the Net my disclaimer

Ok I have been away. My plunge date was the 21st but was to my surprise a high. Since all the other fib dates were lows who would
think a switch was coming. I was to my regret out of site and out of mind at the time. My next turn date based on other works calls for the 18th.
Gann lines should give us the trend with magic number 2058.17 Spx
for Monday May 16th. This week should be a big money maker!
Showing just how overbought we are.
http://stockcharts.com/h-sc/ui?s=%24BPSPX&p=D&yr=0&mn=6&dy=2&id=p92911779640&a=446729007
Friday, March 11, 2016
Newer noiseless charts
Looking at my unch chart we see it getting more overbought. That can mean complacency or excess!Yes it is overbought a signal yet,NO! I have studied this chart back years and see the 83% line as a buy/sell line. If we are below that line and it cross's it is a buy. So we need to see the OB line come down to the 83% to get a sell. Thought's it could lead to one last overblown rally.
LIVE EOD
http://schrts.co/RvMK5v
Next chart is the $BPSPX and after a strong climb it has finally leveled off. Again not a bear till it starts down.
My thoughts is it is a lager not a leader but still has to follow the script . So looking for divergences as alway's. These are simple charts to (kiss) keep it simple stupid.
Live EOD
http://stockcharts.com/h-sc/ui?s=%24BPSPX&p=D&yr=0&mn=6&dy=2&id=p92911779640&a=446729007
Jerry O
ps Draghi wants to buy corp bonds, banks want him to buy non performers. I think he is killing his banks.
So far no overlaping of wave 1 so still bearish lean
LIVE EOD
http://schrts.co/RvMK5v
Next chart is the $BPSPX and after a strong climb it has finally leveled off. Again not a bear till it starts down.
My thoughts is it is a lager not a leader but still has to follow the script . So looking for divergences as alway's. These are simple charts to (kiss) keep it simple stupid.
Live EOD
http://stockcharts.com/h-sc/ui?s=%24BPSPX&p=D&yr=0&mn=6&dy=2&id=p92911779640&a=446729007
Jerry O
ps Draghi wants to buy corp bonds, banks want him to buy non performers. I think he is killing his banks.
So far no overlaping of wave 1 so still bearish lean
Monday, March 7, 2016
Trying to find overvalued
http://stockcharts.com/h-sc/ui?s=%24BPSPX&p=D&yr=0&mn=6&dy=2&id=p92911779640&a=446729007
This is a live chart updating EOD I show the UNChanged and how overbought it gets at highs.
So we are close to a turn down.
Then there are other OB/OS like the RSI vs the SPX and NYA
Friday the rally seemed to peak in late afternoon. This is based on stocks that were much higher and then either closed unch or lower. Was this the overbought mkt peak?
Today added the MACD + some OB/OS areas with guidlines.
Updating my Fib chart and notice the change in date from April 15 to April 21 as I had looked at the wrong date. Thanks Kevin.

You will notice the boxes. The last signal was 144 fibs and we dropped in 9 days 111 SPX points
(2104-1993) If history repeats the mkt should enter that box at some level as a high.
Jerry O
This is a live chart updating EOD I show the UNChanged and how overbought it gets at highs.
So we are close to a turn down.
Then there are other OB/OS like the RSI vs the SPX and NYA
Friday the rally seemed to peak in late afternoon. This is based on stocks that were much higher and then either closed unch or lower. Was this the overbought mkt peak?
Today added the MACD + some OB/OS areas with guidlines.
Updating my Fib chart and notice the change in date from April 15 to April 21 as I had looked at the wrong date. Thanks Kevin.

You will notice the boxes. The last signal was 144 fibs and we dropped in 9 days 111 SPX points
(2104-1993) If history repeats the mkt should enter that box at some level as a high.
Jerry O
Wednesday, March 2, 2016
Strip out the Noise
Today we hit the .618 area on the SPX @ 1978.14+ and important wave ending,I hope.
Futures are up strong at 1:30 AM ET
Window Dressing?
If you look at this chart of the BPSPX you will see where I put the arrows.
What is interesting is the low was Nov 3rd but almost every thing else as far as highs was at or near the 29-1st of each month.
So the high should be in but is it ?

Futures are up strong at 1:30 AM ET
Window Dressing?
If you look at this chart of the BPSPX you will see where I put the arrows.
What is interesting is the low was Nov 3rd but almost every thing else as far as highs was at or near the 29-1st of each month.
So the high should be in but is it ?

Thursday, February 25, 2016
Kiss of death sell.
Looking at the ADX that could be the kiss of death sell that has worked before.
There is a chart from Advanced GET looks a lot like now and how we could pay out to get the April low I look for.


There is a chart from Advanced GET looks a lot like now and how we could pay out to get the April low I look for.


Tuesday, February 23, 2016


Saturday, February 20, 2016


Monday, February 15, 2016
Where's the BEEF?
Pure and simple a momentum run and short covering enhanced by Jimmy Diamond. Strange on a 3 day weekend. Looking at charts to find a
fractal. Not even sure it was a breath thrust. I hope it was a bull trap.
Holiday weeks can have big moves. Color me skeptical.
Later Jerry
Later with charts


 Projection from AGET and my thinking.

fractal. Not even sure it was a breath thrust. I hope it was a bull trap.
Holiday weeks can have big moves. Color me skeptical.
Later Jerry
Later with charts


Subscribe to:
Posts (Atom)