Wednesday, February 18, 2015

Oil in free fall?

Update posted at 10:30 Pm on the 18th
Reviewing my work *I see today is an inside day -I usually consider that bullish if it is near a low but I don't think we are at a low so watch that one.
* 4 TD  sum of volume is low showing confusion with traders.
*Blowout days. I have not spoke of that of late but today was the lowest reading since the last high on 12-29-14 .  FWIW.


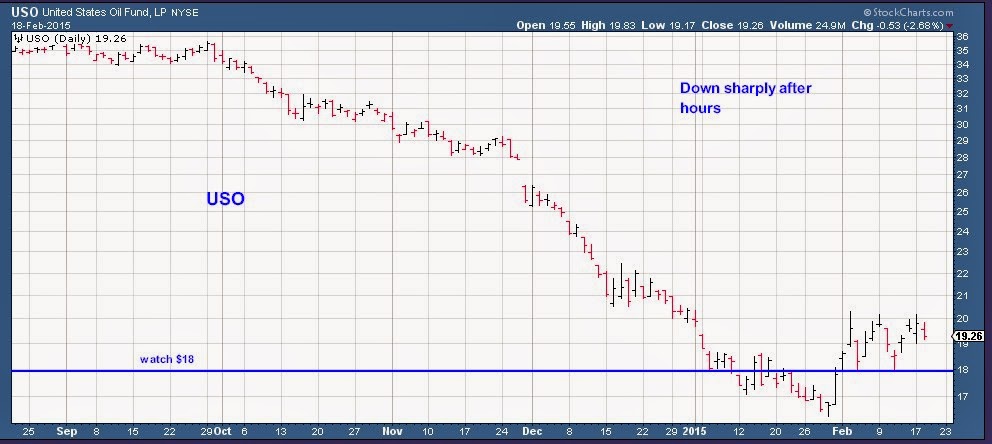
I don't know if OIL rules the Stock Market or not but looking at these charts I would think it has a big hold over the market. The only reason I bring this up is the big dip in USO and OIL today the 18th Feb.
After hours the drop continues. I write in Red because I'm bearish.



Jerry O
I expect fireworks with the options this last 2 days.


Tuesday, February 17, 2015

Down Wednesday

Today was not a good day.
We jammed the close.
We had the Vix up with the SPX = down next day ( 85% of time)
The market internals were not great with deciners more than advances. The last 1/2 volume was a hedge trade I would suspect.


Monday, February 16, 2015

2088 on watch for Tuesday 2-17


The last high we had was on 12-29-14 @ 2093.55 Spx leading up to that we had 8 days in a row of higher highs. Currently 2-13-15 we have 4 Days of higher highs. If we look at the Market internals for the 29th we see a strong thrust into the close with 2/1 advances but nothing as strong as last Friday where we had 190 new highs only 5 new lows and 2/1 up volume. Friday the 13th was much more greedy all around.

I don’t give it more than 2 TD if that greed rate keeps going.


The Advanced Get chart I have built offers a pitch fork nightmare putting us right in that triangle. I offer 2088 as a line in the sand.

You will notice AG has us in a Wave 5 configuration so a sharp move down of 100 SPX points would be expected when we turn.

Is this the final top, I have no clue.

Jerry O

 12-29-14

 2-13-15

Thursday, February 12, 2015

Froth

I can't say when it will happen, ( vix @15.45 today)perhaps a few more days of rally. A new high should make it happen. What will happen is an overbought condition that can reverse real fast.
On my chart you will  notice at the last ATH 2093 we went to 1992 in 5 TD's.
The next chart shows the MFI on the bottom also in the overbought area.


Sunday, February 8, 2015

Quad

Friday I would like to believe that the quad resistance played a part in the turn down.. You will notice we were also at the 78% level.


I would get a CIT and trend change around 2045 ish.

Monday, February 2, 2015

Why stop at resistance?

First the bad new, home heating oil just went up 8 cents a gal in my area, so maybe oil is at least resting.
As far as the market I had a mechanical trend change to up. Nothing else to tell me any thing.
I sure don't like where we stopped, but if we can break higher to next resistance that would be strength..


Saturday, January 31, 2015

Thursday Low

I would like to believe that Thursday was the low of this cycle.
If you see the triple top on my chart, that I should have seen at the time, then why not a tripe bottom as seen now. I also should have used my stop at 2038.
In the market there are always second chances to get it right, if you don't go broke.
Monday could drop to 1972 and rebound strongly but I think we will know right at the open. I really don't expect that plunge.


Tuesday, January 27, 2015

Reverse back up? UPDATE

 Unless this chart is something!
We are on a sell and trend change unless we can close above ( not sure yet)  I did buy a Oex put  midday $5 and sold for $10 on close. Why because I think this chart is bullish. We will see!

UPDATE Not looking good here at 2:30 PM Wed. Trend change to down and sell signal based on Spx 2030 line in sand.

**************************************************************************

No chart, just facts as seen by my eyes.
Trend is still up.
No blow out day, but still I think we reverse back up.
Support at 2019 again held.
Did buy an OEX 890 call at $9.90 hoping for $17
EDT  close?  Maybe.  :)
Apple and Fed could push us up.
Jerry

Monday, January 26, 2015

Update on the 26th close


As far as today went I was out most of day but an excellent chance to get a secong long ( call ) when we hit SPX  2040.97. That kept me in the green zone on the chart.
Today looked like an  green 4L  low am, so tomorrow could be hi pm, not going to explain that.


Nothing has changed as far as direction and hope for SPX 2100 by Friday.
Do not confuse color days with my trend chart. There is a link on my blog on the right for color days.

Looking at the Dax  vs the SPX a clear picture where we are going! Jerry


Sunday, January 25, 2015

Blowout days

Sunday update, Still on a buy as we remain in green zone, Monday could be up big depending on Greece.
Comment on Thusday

Thursday Jan 22nd we had a blowout day. I consider that a day where we have a range of at least 1.80% or higher. I will list several such days below.
I have read on other sites that a big move happens near the end of a cycle. They maybe talking about a blowoff rally. I have yet to see one on the samples that I looked at.
This blowout day can either be up or down but I don’t find it a CIT in any way. I don’t think it even has Elliot Wave connections. You may think a blowout day has a lot of meaning, but I don’t find a link in my study with many hours of chart reviews and bar counting. I think a study of the trend will tell you what happens next on those days and if it will reverse. In summary blowout days are not a CIT (change in trend), not a top, or a bottom just short covering or unwinding positions.
My 2 cents  Jerry     TimingShortterm yahoo groups


To make it clearer
10 TD means 10 trading days.
The color green is up and red is a down trend.
So 3 red across is a strong down trend.
We are currently in an uptrend.


Ps numbers mean nothing as far as this chart.