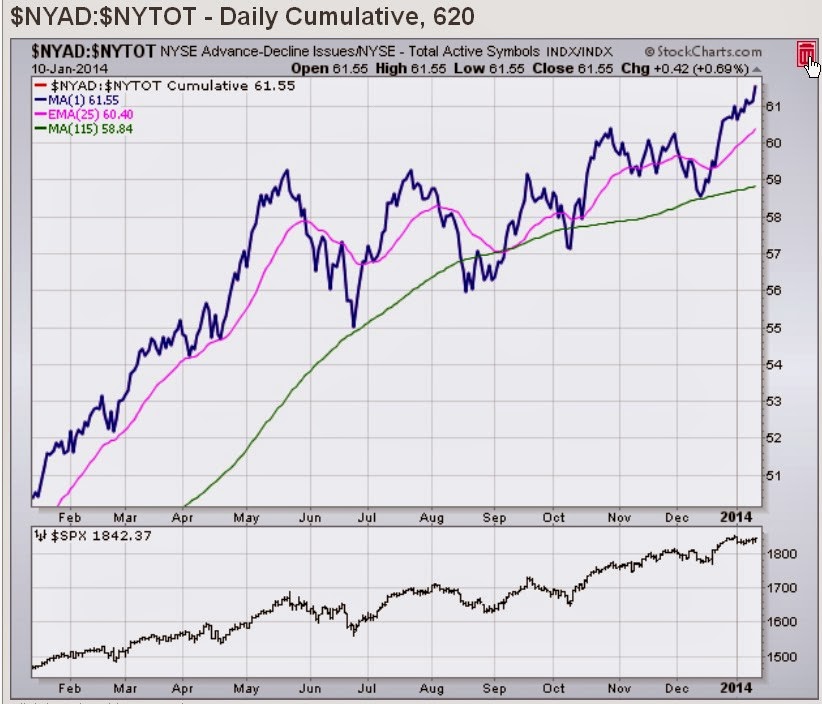
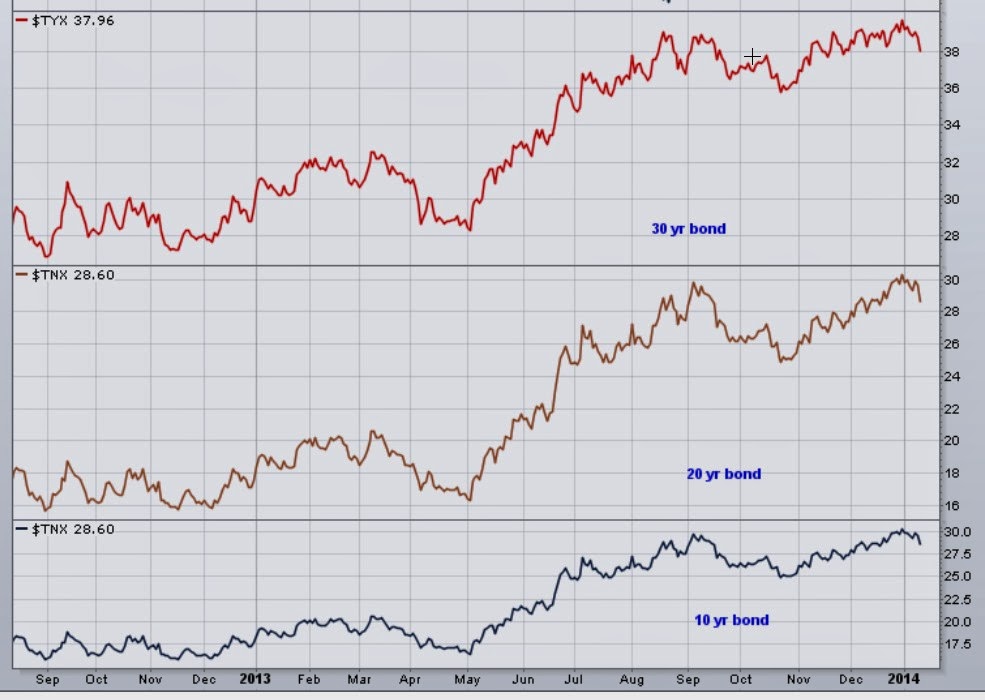
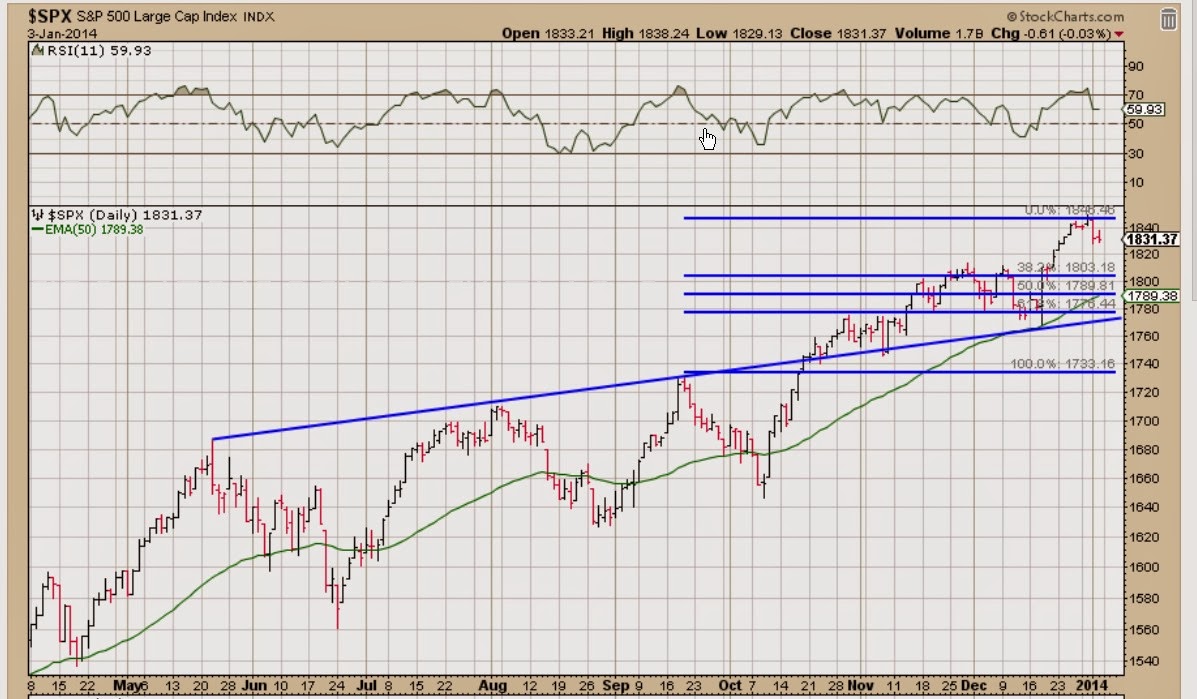
If you can trust this chart it looks very bearish. A down Monday coud start the ball rolling.
Jerry
Trending the SP500 SPX using proprietary cycles. A mechanical program (excel formula's) and the use of Advanced Get (Elliot waves) to both visually show what my spread sheet offers and how Advanced Get understands it. I'm also using a MOON COUNT that has been working nicely! Use at your own risk to supplement your own work. Jerry
Saturday, February 22, 2014
Saturday, February 15, 2014
Saturday, February 1, 2014
Two EW counts
Click charts to enlarge and read.
Jerry O
Chart #1 looks to end a 5th wave down at 1752 to 1725 Spx. This is not favored by me because it puts my topping view at risk.
Chart 2 is my perferred count based on a lot of studies at tops and makes a nice package.
We wait.
Jerry
Jerry O
Chart #1 looks to end a 5th wave down at 1752 to 1725 Spx. This is not favored by me because it puts my topping view at risk.
Chart 2 is my perferred count based on a lot of studies at tops and makes a nice package.
We wait.
Jerry
Sunday, January 26, 2014
The top is IN.
Update 29th 1pm Fed day:
Here is what I think Avanced GET would like to see.
If this is Wave 5 top then we need to on average drop in 10+/- TD drop 88 SPX points.
Looking back at several important tops that is a ball park time and number.
So unless we can take 1850- 88 = 1762 target soon then I don't see wave A forming.
If we do plunge to that 1762 it would be a buy for 5 TD's
So we wait.
Not trading advise.
The chart below I used to pick the top and it is updated. You can see the earlier chart way below. Yes I had Dec 31st as the top at Spx 1849. But the gann lines put the timing much closer. They also agreed with my projection area.
I came up with that projection by finding the points beween wave 2 and wave 3 and then adding them to wave 4 and that projected count.Wave 5 moved up as usual as mkt climbed. What's Next ?
I believe we hit Spx 1778 per the gann line. That is not the only TA that would offer that area.
I'm not trying to brag but this same progam called the bottom on March 6th 2009. I was at the Time and Cycle board at that time and many Elliot wave types scoffed and thay will here and now.
I still think the lower caps will rally into March like the year 2000 did. Jerry
Here is what I think Avanced GET would like to see.
If this is Wave 5 top then we need to on average drop in 10+/- TD drop 88 SPX points.
Looking back at several important tops that is a ball park time and number.
So unless we can take 1850- 88 = 1762 target soon then I don't see wave A forming.
If we do plunge to that 1762 it would be a buy for 5 TD's
So we wait.
Not trading advise.
The chart below I used to pick the top and it is updated. You can see the earlier chart way below. Yes I had Dec 31st as the top at Spx 1849. But the gann lines put the timing much closer. They also agreed with my projection area.
I came up with that projection by finding the points beween wave 2 and wave 3 and then adding them to wave 4 and that projected count.Wave 5 moved up as usual as mkt climbed. What's Next ?
I believe we hit Spx 1778 per the gann line. That is not the only TA that would offer that area.
I'm not trying to brag but this same progam called the bottom on March 6th 2009. I was at the Time and Cycle board at that time and many Elliot wave types scoffed and thay will here and now.
I still think the lower caps will rally into March like the year 2000 did. Jerry
Thursday, January 23, 2014
100 year cycle WHEN!
We have the panic of 1907 that Ben Bernanke
has talked about many times. We see a low in 1915 almost same area.
I believe 2007 to 2015 will have the same result.
My guess is we will rally in the lower priced stocks till mom and pop run out of money and then the house of card will come down.
A good example of that was yr 2000 where
low priced stocks were lifted by the water.
You can expect money to come out of high priced stocks like Intc and Cat and many more.
Yes the high in Dow probably is in but the Russ will run till late March.
Place your bets but get out when prices go to I can't believe it, highs!
Jerry
Click charts to enlarge, you can also see historical charts like this at StockCharts.com ( free)
Tuesday, January 14, 2014
Saturday, January 11, 2014
Rally Coming
Big Rally coming???
This chart looks bullish..
When a market goes sideways for 2 weeks and doesn't do what you expect on a bad number like Friday, then you have to switch you thinking fast.
BIG OE RALLY??????????????
Big breakout in the Transports !
Big breakout in the Util!
Big break out in Corp bonds !
All Gov't bonds going down
Short term view of the SPX with higher highs and higher lows.
We could ATTACK that higher trend line.
Saturday, January 4, 2014
Still looking toppy to me.
This is a chart that if it goes lower could offer a big bear view of the ecomony.
Click chart to enlare\ge
Sure the Rut was bullish Friday and may make a run but so far not as strong as earlier
This to me Targets SPX 1780 sooner or later.
I think this is the most important chart.
If it starts up like 2000,2007 and some of 2011 you can bet on a bear market.
So far we need to see buit a good clue to the future.
Jerry
Sideways at best.
Click chart to enlare\ge
Sure the Rut was bullish Friday and may make a run but so far not as strong as earlier
This to me Targets SPX 1780 sooner or later.
I think this is the most important chart.
If it starts up like 2000,2007 and some of 2011 you can bet on a bear market.
So far we need to see buit a good clue to the future.
Jerry
Sideways at best.
Thursday, December 19, 2013
Getting Toppy 12-19-2013
Sold stocks today that hit new highs like HIMX and buying some SPXU.
Many divgerences on these charts. Trans,Util etc.
Saturday, December 7, 2013
Still looks good to ME
Advanced Get bullish view
We bounced right back to where it started.
We need to hold this line.
5 day chart
Subscribe to:
Posts (Atom)