Saturday, April 6, 2013

Wednesday, April 3, 2013

Red Flag is UP

Wed April 3rd 2013
So many groups broke down today I have to put up a red caution Flag.
I think we need to be prudent to see how the  market will unfold here. Meaning I don't know if the high is in till we see the retest. We have to consider the EMP # Friday.
I had a target of 1576 so will consider 1573 as very possible ending the rally.
Jerry O     1571-1549=22/2 =11+1549= 1560  Target 1560 ish to short again,Thursday
Fun and games of course.

Saturday, March 16, 2013

Higher we go.

Disclamer, all I know about EW is what Advanced Get tell's me!
This first chart is when I called the bottom as a member of the Time and Cycles site. Many EW people said I was totally wrong and the program was junk.unhuh!
I notice that in bear trends that the 5th wave is short with the gravy wave 3 or some call a C is very long

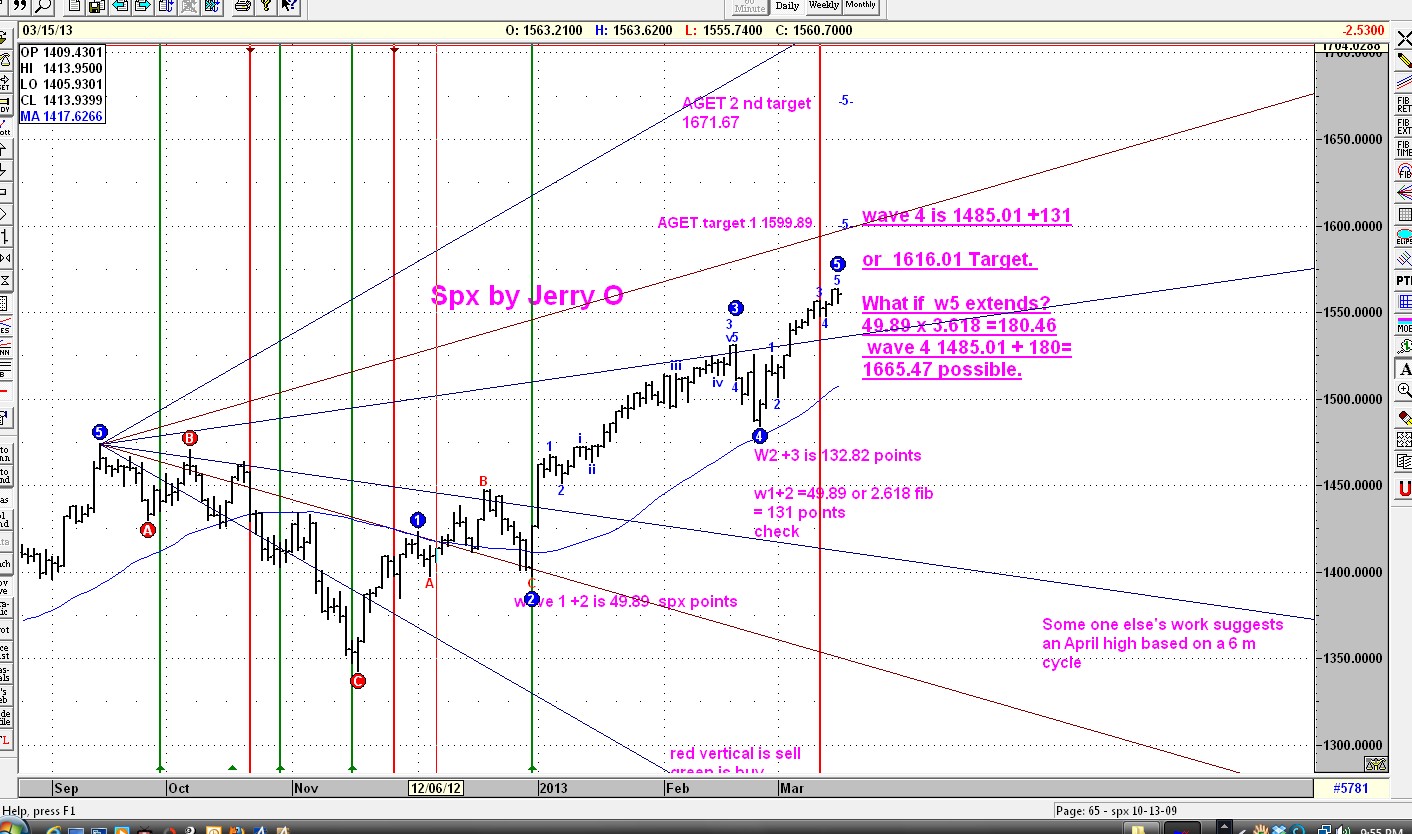
The latest count of March 2013 has a weekly view with a target of 1576.03 Spx if the wave is not extended.
I find in the program that bull trends have a lot of wave extensions. The weekly fan is getting tight.


click charts to enlarge.
The daily is up close and personal.
Here we see a target of 1616.01 with more fib relationship. BTW the 5th wave doesn't have to be straight up if extended so a few bumps could happen. You will noticed  the built in targets of the program are 1599.99.
The green and  red lines are program bias, some work perfectly.
1616-1576 = 40 point spread.

OEX and XSP ration are bullish for  Monday, day after a triple witch could be weird.
How will I know if I will be wrong?
If 1530.93 falls by more than 1 TD this count is wrong.

Saturday, March 2, 2013

Are we at a top NO!

 Click image to enlarge.
Why do I make a bold statement like that? History.
* 1st Chart is 2007 high where the Dow and Spx peaked together with a 16TD cycle (roughtly)
That Oct 11th was a GREEN DAY
look at Color days to left under favorites. Volume got heavy 16TD before top.


Next we have the chart of 2000 highs
You will notice or still remember that the Dow did the job on Jan 14th
 2000 a RED DAY and the SPX hit a high on March 23rd  with Dow close, a 16td pattern and a BLUE DAY


The 1987 CRASH, I don't have a chart since the data is hard to find.
Here is what I found out.In 1987 the heavest volume was a Aug 11th a BLUE DAY  and 10td  before top. On the Dow the actual closing high was 8-21-1987 a GREEN DAY.
Yet the Dow theoretical high was on Aug 25th and the Spx intraday and close I 337.89 c 336.77.
A GREEN DAY. Funny HANKS says a green day is go, I say run.
StockCharts in their history charts show 335.89 spx I don't know what gives there.

SO GREEN days are high on the list.
Early heavy volume and 16TD, high on list.

AND SPX MUST HIT A HIGH near the DOW.

Yes we can have a big correction but it won't be over till the SPX  fat cats sing!
Jerry

Monday, February 25, 2013

Wave 3


Sunday, February 17, 2013

Charts look weak, BUT!

 NYAD getting weak?
 SP industrial getting weak?
 Daily candle looks on a sell.
Oex P/C ratio .80 too bullish?
not shown.
 Stocks above 50dma breaking down?


Black line is Spx vs Dax.  Dax is breaking down can Spx resist?

Thursday, February 14, 2013

Dax vs Dow

 I don't know the Spx Industrials are looking weak.
The market could be playing rotation and this group will catch up. If not look out.
Here we have the Dow vs Dax.
If the Dax was leading and now falling some thing has to give. The DAX is down  264 points in 13 TD's

Monday, February 11, 2013

AAPL resistance ?

Click to enlarge.
AAPL  hit a double bottom blue line, then hit the support green line, only to break down to the gap fill. It has now rallied back to the green now resistance and circle gap.

$483.10 could stop it cold .

Jerry O


More- Nightly business report:

Year of Snake down 3% since 1900 .

Monday Feb 11th was a weird day. It was neither SU,SD,inside day or outside day. I had to go back to 12-29-2009 to find the same and suggests to me we could test 1500 by Wednesday Spx.

Saturday, February 9, 2013

Tops rwo

The Fib Queen
Watching her the other night, she has 2 favorites. The 8/34 MA  and 1.272
If we take the 11-16-12 *closing* of spx 1359 *6.272% we get 1446 the almost exact close pivot high on 12-18-12

So if we take the 12-31-12 pivot close low of 1426 *5.272% we get *1520* close.

Now 1520 close can't be a top because we need a candle like this for a top!


http://stockcharts.com/school/data/media/chart_school/chart_analysis/introduction_to_candlesticks/candle1-longshadows.gif


Many will shoot this down. LOL

So let me say it this way. If 1220 close  is a top, intra day we need to run up to ideally to 1229+

thoughts?

Thursday, February 7, 2013

Looking at Tops

 This is a weekly view of the SPX just to see if things look right or wrong.
First is 2000 top then 2007 top and current market.
Jerry


The look ,could they be waves?