Thursday, March 3, 2011

Stay Bearish unless

Why to stay bearish? Thursday. 3-4

The stock market hates 2 things! Good news and uncertainty we have both.

I think you want to ride with the gap direction for Thursday till 9:45 then watch for a reverse.

The S1 and R1 support/resistance will get hit as a guide.

Dax and Ftse are important leaders.

Even the Sox that was so strong has flat lined here. chart below......

Speaking of the Resistance R2 is spx 1320 or just about 61.8%

of the 1332-1303 . I would not want to see us go above that 1320/1322 area on a close basis.

Tuesday recap 3-2

My view is 10 days ago a formula I used pulled spx 1333 out and we stuck there for 3 days. I thought that was the high but we went a little higher. Now we are to test that again with a 78.6% hit =1333. I hope that will stop it like a brick wall. I don't understand Roy's count but his first number is a throw away and when we come back to a fib hit that should be it. On the table also is the % of stock above the 50dma flat lined today on an up day. We had the up-volume actually down. With a weak trin most of the day the bear will rule Tuesday if 1333 holds. I would also watch the Dax as an early clue.

Sunday, February 27, 2011

Choppy for a few days


Thinking a choppy few days then we see. The down trend is weak. Perhaps you noticed money came out of the blue chips and filtered down to $30 or less stocks. True signs of rotations and speculation. Cheap stocks could have a good run for a few weeks.

Looks like the Upvolume burned a few dollars trying to move a few points to 1st resistance


The % above 50dma makes me think chop like when we tested 1173 several times


Friday, February 25, 2011

How much rally?

Technically we have done no damage yet!
Looking at the chart below it have us down in the area of the last low. Peaking around 11-5 at 1227 then tanking to 1173 and testing that area for weeks. Things could level out here with a bounce. Bears watch spx 1311 then 1327. I think 1311 a good pivot on a clsose basis. We need to tighten up to get a big move I think.
VIX +SPX calls for up day Friday.

This is a % of stocks above their 50 day ma. The actual sell comes under 50% but I notice direction helps.

Tuesday, February 22, 2011

Change in Trend??

I think we need to see the strength of the next rally.The trend is down as long as we don't close above Spx 1325.65 but I think that 1333.20 maybe the watch number.
Today was almost a carbon copy of the 28th plunge. upvol 13% vs 9% today, trin 1.30 vs 1.15,tick -653 vs - 634 and the vix over 20 both times.. I think we open higher then ????
The only thing that is showing this market is getting weak is the % of stocks above there 50 day m.a..
Where the circle is, is the 28th plunge

Last week of Feb 2011

My thoughts and the gann wheel below
Spx If 1335.63 fails, then 1328.01, but 1326.66 on a close basis offers something deeper.
In percents 2.5 = 1310, a break of 1300 would put 7% at 1249.99 on the low area and gap fill target.

Sunday, February 13, 2011

Trend UP unless

Friday was a 144TDH was that it? Well till we go down the trend is up no magic bell will ring.
If this really is an EDT it's extended by the count I have on the chart.

Here is another count I have:

If 2002 low spx 768.63 and ATH 1576.09 = 807.46 points *17.618 =665.20 actual low 666.79. Then ATH 1576.09- 666.79 =909.30 points*46.618 = 1333.20 High so far 1330.39 stay tuned! This count offers higher as a 5th wave will offer.

Bearish view: On a close basis we need to watch Spx 1325.75, then 1314.69 and finally we could put more trust in a CIT at 1308.77/83 or weaker close. One thing we can all agree when it starts down there will be no getting on even thought the dipsters will try. Gap at 1250 and AGET target 1212 All Spx

Thursday, February 10, 2011

More weakness appears

I have to stay with this theme above.. We have the spx+vix up today = down Friday (75% of time it works). Still watching this fractal, not the close, but the range, as history rarely repeats.
Watch spx 1313.63, then 1302.83 on a close basis.
The weakness I see: The % of stocks above there 50dsma is getting weaker as we rally. This is a different event since Aug. I have marked off a few dates with a line that could be a catalyst.
Some one said to me today I think 1300 holds, but the more I think about it, if not, a panic will unfold. I do have 1212 down the road but I have higher numbers too.Price is KING for direction.

Click any image to enlarge. Speaking of what is different look at rates climb. Some thing is a miss Watson. Other than above comments the trend is UP.

Weakness appears

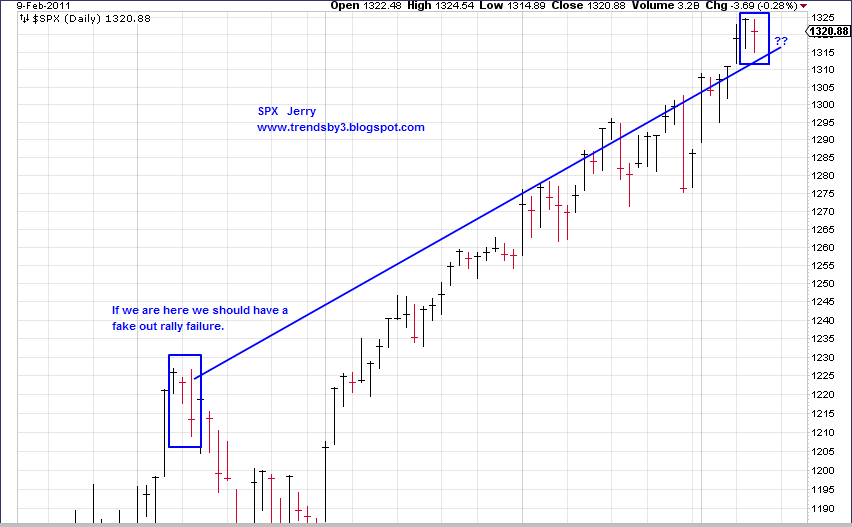
Is this a Short term top? Need to watch one more bar, a rally failure could do the job. Even at that I think the target is 1212 Spx based on yesterdays chart. Right too the area where the last correction started.


This is a chart of the SOX vs SPX the dates I have marked off on the cross over didn't really do much to the market. What we do need to watch is both turned down. We need to watch that.

Jerry

Wednesday, February 9, 2011

Trend remains up even if correction.

From yr 2000 high we get 1360.22, from the 2007 high we get 1380.98. A pull back at anytime could only offer 1212 spx. So a seasonal rally or plunge into April 25th ish not out of the question.

We need to keep an eye on rates as they start to creep higher.

Monday, February 7, 2011

Trend Still Up unless

We have the EDT still in force. 1315 area or as AGET says it's complete now with (5)-5-V.
I have put on the target the elips offers 1280-1250
Monday watch 1309.02 then 1297.07 ( pivot @ 1298.52) then 1294.64 other than that, I see no chance of a CIT.
This chart of the percent of Spx stocks above their 50 day SMA is not all that bearish as yet.
A break under the 50 level is an alert and under 45 a sell officially.
I have added speculative lines that in fast markets give good sells or buys. Some key area's like January high 2009 and March low 2009 stick out. Mid Oct 2010 vs Jan 2011 may offer a divergance since we have climbed higher but basically we are are still in buy the dips mode.