We do have an aggressive buy above 1070 for Friday. This can be a whipsaw pattern that is why it's aggressive,
This is for fast traders only.
Friday, July 9, 2010
Monday, July 5, 2010
One Favorite Indicator SPX
I use the last 10 minute bars to project next day opening direction. We had a very bearish close Friday and I would normally expect a gap down open next business day. Even with 3 day holiday it still should work.
Jerry
Jerry


Thursday, July 1, 2010
All down
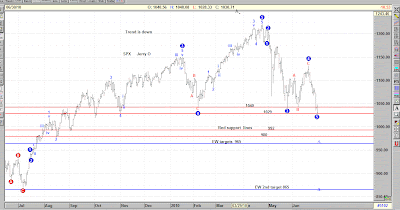
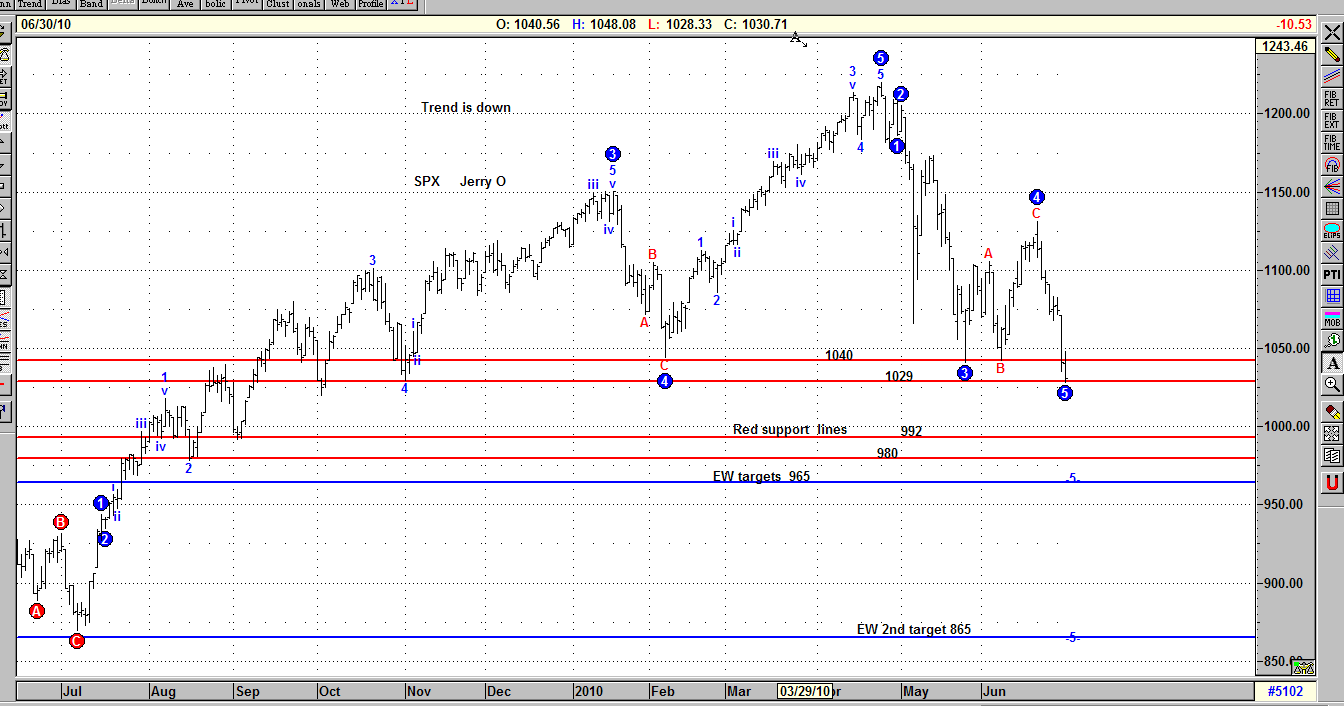
Targets support 1040 gone,1029 gone, next 992, 980 and some much lower EW targets
Went to total sell on open Tuesday this should not turn back too quickly.
My momentum indicators are getting OS and it's possible we test a low Friday depending on market action. Not shown.
Went to total sell on open Tuesday this should not turn back too quickly.
My momentum indicators are getting OS and it's possible we test a low Friday depending on market action. Not shown.
Tuesday, June 29, 2010
ALERT a CIT DN could be forming
Today's action was the pits! (Monday)
A close under 1064 SPX will turn all cycles to down on Tuesday 29th
Futures are at 1063.80 at 1:15 am so not a lot of wiggle room.
This is only a warning not advise.
Jerry
A close under 1064 SPX will turn all cycles to down on Tuesday 29th
Futures are at 1063.80 at 1:15 am so not a lot of wiggle room.
This is only a warning not advise.
Jerry
Sunday, June 27, 2010
Cricital area MOB
Short term (days) sell was on 6-24 open
Med term (wks) Buy still holding my cit signal
Long term (mth) sell
If we break 1048 Monday then wave (5) targets and down CIT should set up and fast.
That seems to easy and look for a run to 1140/1150 completing a H&S pattern
We have both EOM & EOQ strength, (window dressing).
Seasonals are bullish for the 1st week in July.
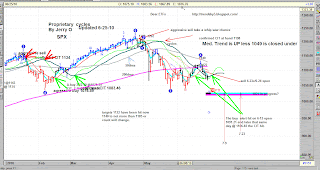
Like to think 1073 fann area will hold. chart 2 days ago, below.
Have a 15 degree hit on the 8th of July that could be the summer high.

Med term (wks) Buy still holding my cit signal
Long term (mth) sell
If we break 1048 Monday then wave (5) targets and down CIT should set up and fast.
That seems to easy and look for a run to 1140/1150 completing a H&S pattern
We have both EOM & EOQ strength, (window dressing).
Seasonals are bullish for the 1st week in July.
Like to think 1073 fann area will hold. chart 2 days ago, below.
Have a 15 degree hit on the 8th of July that could be the summer high.


Friday, June 25, 2010
Getting OS support soon if not now.
LT dn
Med up
ST dn signal 6-23 close
 I think the gann lines will hold here on the Advanced Get version of EW??
Med up
ST dn signal 6-23 close

Sunday, June 20, 2010
Trend is UP
Long term: Bearish
Medium term: UP
Short term: UP
 My alert last week of a CIT was timely.
The following charts show we need to punch down to 1035 just to turn trend down.Spreadsheet test.We went to a agressive buy on 6-15 open and later that day a trend Up (CIT) @ 1106.83.
Due to this as moving daily the actual price was 1103.
My AGET chart shows we are in an A,B,C (4) with 1122 considered hit and leading to SPX 1140/1185 probably 1140/1155 is a good target.
My S/R chart showing how important the 1040/1155 area has been since 1999


Medium term: UP
Short term: UP

The following charts show we need to punch down to 1035 just to turn trend down.Spreadsheet test.We went to a agressive buy on 6-15 open and later that day a trend Up (CIT) @ 1106.83.
Due to this as moving daily the actual price was 1103.
My AGET chart shows we are in an A,B,C (4) with 1122 considered hit and leading to SPX 1140/1185 probably 1140/1155 is a good target.
My S/R chart showing how important the 1040/1155 area has been since 1999


Sunday, June 13, 2010
Trend could be changing to UP
We went to a VST buy on the close Friday.
If on a closing basis we
are above 1106.83 SPX we will have a CIT to up!

If on a closing basis we
are above 1106.83 SPX we will have a CIT to up!

Tuesday, June 8, 2010
Major Trend still down...
We seem to have a low on the 7th at this posting so the 16th a lower higher( see degree chart under)? We had VST buy/sell and a need to hit 1094 as of today to get yet another VST buy not tradable.
As far as I can tell we are still in a Wave (3) down less that target of 1102 that was hit is a wave (4) at the 200 dma resistance, and we plunge. We have many points of protection so we stay short with Bear ETF's till this cycle plays out.This is not a churn your account type system so relax.

As far as I can tell we are still in a Wave (3) down less that target of 1102 that was hit is a wave (4) at the 200 dma resistance, and we plunge. We have many points of protection so we stay short with Bear ETF's till this cycle plays out.This is not a churn your account type system so relax.

Subscribe to:
Posts (Atom)